Why Is Graduate Unemployment 17% in Tamil Nadu and 33% in Telangana?
An analysis of graduate unemployment in 31 states and Union Territories
Topics: Graduates · Unemployment · States · Jobs
Discussion draft
The southern states have some of India's highest shares of young graduates, yet very different rates of graduate unemployment.
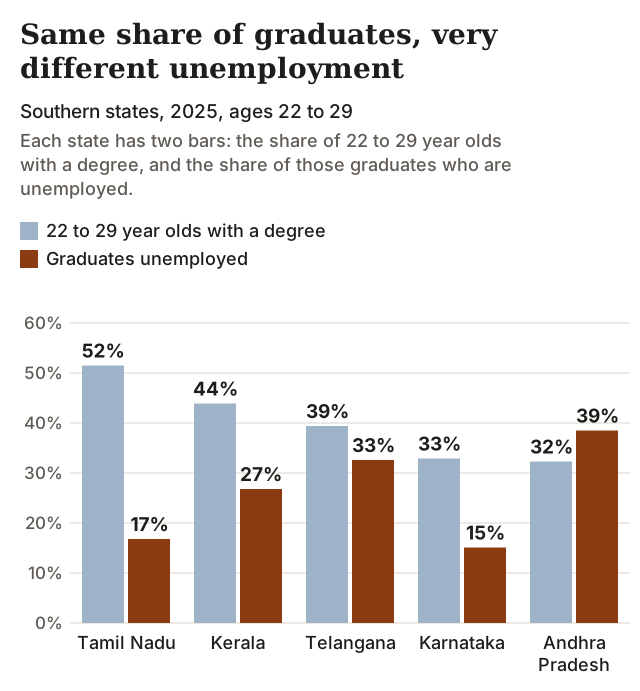 Source: Ministry of Statistics and Programme Implementation, labour survey 2025; our calculations.
Tamil Nadu has a larger share of graduates than Telangana, half of its 22 to 29 year olds against two in five, yet half the graduate unemployment: 17% against 33%. Andhra Pradesh and Karnataka have the same share of young graduates, a third, but graduate unemployment is 39% in one and 15% in the other. Tamil Nadu has about 49 lakh graduates aged 22 to 29 and Andhra Pradesh about 21 lakh, yet the number without work is the same in both: about 5.6 lakh in Tamil Nadu and 5.7 lakh in Andhra Pradesh. What explains the difference?
What the evidence shows
We began the analysis with the five southern states and then extended it to 31 states and Union Territories. What we found, which we call the 2S2D enterprise framework (size, spread, density and diversity), is that graduate unemployment is lower in states where private enterprise is deeper and larger, spread more widely across the state, and anchored in more than one sector. This holds across the states and Union Territories in every survey year we tested, from 2011-12 to 2025. The framework measures that enterprise base through four criteria:
| Criterion | The question | The measure | Bar |
|---|---|---|---|
| Density | How much work runs through substantial private employers? | Share of workers in private workplaces of 20 or more | 11% or more |
| Size | Are there large employers? | Factories with 100 or more people per lakh population | 4.5 or more |
| Spread | Does scaled enterprise reach beyond a few places? | Share of districts, and of young people, in districts with enough registered employers of reasonable size | 50% or more of both |
| Diversity | Is the economy anchored in more than one sector, including one that hires graduates? | At least two non-farm sectors each 10% or more of output and of jobs, one of them manufacturing or a tradable service | 2 or more sectors |
We set the bar for each criterion on the twenty states and Union Territories with at least 1% of India's young people. A capital-concentration flag sits alongside: we raise it when a state's leading city, counted as its whole urban agglomeration, has four or more times the registered employers of the next urban centre.
The association is modest to strong, depending on the year, and in 2025 it changes little after allowing for how rich and urban a state is. The five areas with the highest graduate unemployment, Nagaland, Arunachal Pradesh, Mizoram, Meghalaya and Jammu and Kashmir, at 39% to 54%, meet none of the criteria. It is not proof of cause: firms may also locate where graduates and infrastructure already are. We also checked change over time. Between 2011-12 and 2025, 10 of 29 comparable areas gained at least one criterion, but across areas the gains did not line up with falls in graduate unemployment. That is to be expected. The criteria work together, the number of graduates rose sharply over the same years, and each measure is a proxy: size counts only factories, and density counts how large workplaces are, not how good the jobs are. With so much changing at once, no single criterion can be isolated. The 2S2D framework is thus best read as a profile of the economies in which graduates do well.
The framework also sorts states for young people as a whole, though on a different measure. Youth unemployment shows no link with the criteria, because young people who cannot afford to wait take whatever work exists. But the share of working young people in regular salaried jobs rises with the criteria a state meets, and the link holds even on the criteria that do not count formal jobs directly: fewer than one in five in Uttar Pradesh, Madhya Pradesh and Bihar, three in five in Tamil Nadu.
Nevertheless, in our view the 2S2D enterprise framework has some practical uses for policy.
Reframing the Problem: India's Graduate Unemployment Problem is a Shortage of Good Jobs Not a Supply Side Problem of Education or Skills
India's graduate youth unemployment problem is a shortage of good jobs. Between 2011-12 and 2025 the number of graduates aged 22 to 29 more than doubled, from about 2.4 crore to 5.5 crore. Jobs that need a degree did not keep pace. Graduate unemployment rose from 19% to 33% by 2017-18¹ and has since fallen to 21%, because more graduates took jobs below their qualification. Of every 100 graduates working or looking for work, those in jobs that do not need a degree rose from 32 in 2017-18 to 46 in 2025; those in jobs that need one stayed at about 33.
The states show both sides of this. Where there are many graduates but little private enterprise, graduates either fail to find work or settle for less. In Andhra Pradesh and Telangana a third or more are unemployed. In Himachal Pradesh, where two in five young people hold a degree, three in four working graduates are in jobs that do not need one. Low unemployment can hide the same problem. In Uttar Pradesh, Madhya Pradesh and Chhattisgarh fewer than one in five graduates is unemployed, but more than seven in ten of those working are in jobs below their degree.
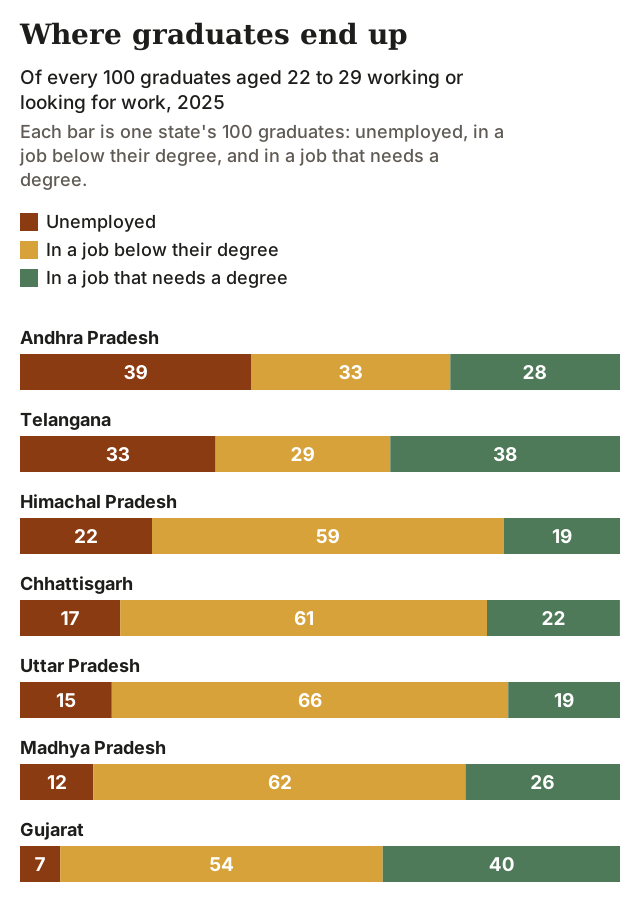 Source: Ministry of Statistics and Programme Implementation, labour survey 2025; our calculations.
Education and skills remain important. We do not have a ready measure of college quality, so we use school learning as a proxy. In the south, graduate outcomes do not line up with school learning: Tamil Nadu has the region's weakest school scores and among its lowest graduate unemployment, while Kerala has the best scores and higher unemployment, and Andhra Pradesh and Karnataka score the same yet differ by 39% to 15%. The difference appears to lie more in the demand for graduates than in their supply. India must therefore prioritise the promotion and scaling of private enterprise.
The need of the hour is the creation of enterprises at scale. Some will be new start-ups. But scale, spread and speed are more likely to come from identifying, district by district, the clusters and enterprises that can grow, and helping them to grow.
Diagnosis: Disaggregating the Underlying Causes of Similar Unemployment Rates
The same unemployment rate can hide different problems, and the framework separates them. Telangana meets only one of the four criteria, size, and falls just short on density and spread, and its formal economy is the most concentrated of any large state: greater Hyderabad has three-quarters of its registered employers, 31 times the next urban centre. A third of its graduates have no job. Kerala meets three criteria but lacks large employers. It has the lowest share of working graduates in jobs below their degree among the five southern states, while more than a quarter of its graduates are unemployed. Andhra Pradesh lacks density, large employers and an anchor sector, though its employers are not concentrated in one city. Karnataka meets all four criteria and has low graduate unemployment, but Bengaluru holds more than half of its registered employers and ten times the next district, Dakshina Kannada, home to Mangaluru. That concentration points to a clear way forward, building scaled employment in other cities, and is visible in the well-known strain on Bengaluru's infrastructure. Tamil Nadu is the contrast: greater Chennai sits right at the concentration line, but Coimbatore is a real second city and scaled employers reach most of its districts. Gujarat and Haryana meet all four criteria but miss the target, because more than half of their working graduates are in jobs below their degree (58% and 55%). Gujarat leans most heavily on factories: a third of its output comes from manufacturing, and only 3% of its workers are in professional and related services, among the lowest of the larger states.
Instruments: Picking the Right Ones to Build Enterprises by Region and District
Governments have tried many ways to improve job outcomes for young people: subsidising apprenticeships, internships and entry-level jobs. These have had mixed success. Incentives tied to hiring largely pay for the formalisation of jobs that already exist. Internship and apprenticeship schemes have stumbled because young people are reluctant to move far from their home districts. The 2S2D framework points instead to the base underneath: private workplaces of 20 or more and factories of 100 or more, in more than one city and spread across the state. That calls for deliberate industrial policy at the district level: building clusters where firms, suppliers, buyers, skills and services reinforce one another. Surat, Tiruppur, Firozabad and Coimbatore show that clusters can be greater than the sum of their parts. The need is to grow them and others like them outside the capital, and to raise their productivity as they expand, so that they create jobs at higher levels of skill.
Next steps
Testing the theory needs better data. Its central hypothesis is about enterprises: that private workplaces of a certain size, spread across a state's districts, are what absorb graduates. Testing that properly needs data on individual enterprises by size, sector and district, which are not available at present. We will test the framework further as more data becomes available, above all establishments by size for every district and sector, and where graduates work as well as where they live. We will review the framework next year against the new labour survey, with the bars held where they are.
Job creation is arguably India's most pressing demographic, and democratic, challenge. What is clear is that state policy has a large role to play in employment outcomes, in both senses of the word: the state as government, and the states themselves. As governments, central and state, consider how to address it, we offer the 2S2D enterprise framework in the spirit of discussion.
Method and limits
Coverage. We measured each criterion for 31 states and Union Territories in each year from 2017-18 to 2025, and for the 30 comparable units of 2011-12, using each year's own population. Spread before 2021-22 uses the 2021-22 employer counts, the earliest district figures published; four 2011-12 values are missing and count as not met.
Outcomes and target. The outcomes are graduate unemployment at ages 22 to 29 and the share of working graduates in jobs below their degree. A state meets the target when graduate unemployment is 20% or less and no more than half of working graduates are in jobs below their degree, with up to 2.5 points allowed on each for sampling error.
Bars. We set each bar where it best separated the states meeting the target from those missing it, using the twenty larger states and Union Territories over 2022-23, 2023-24 and 2025, and we hold the bars fixed from here on: density 11%, size 4.5, spread 50% and diversity 2. The fitted values for density and size, 11.42% and 4.83, are rounded down to 11% and 4.5; no state that meets the target loses a criterion as a result. For spread, a district counts when it is at or above the India district median on both registered employers per lakh people and members per employer. For diversity, a sector qualifies when it holds 10% or more of both the state's output and its workers; shares above 9% are rounded up to 10%, so states on the border are included. The capital-concentration flag is set at 4 times.
Check. The years not used to set the bars, 2011-12 and 2017-18 to 2021-22, show the same direction: states meeting more criteria have lower graduate unemployment.
Limits. Density, size and spread overlap and together describe one enterprise base. Size counts factories only, so it misses services such as information technology. Registered employers are counted where they register, and registration responds to government hiring incentives, so we read spread alongside density, which comes from the household survey. Survey design and occupation codes changed over the period, so changes over time are approximate. With few states and criteria that change slowly, a few years of data cannot show which criterion moves graduate unemployment.
Notes. ¹ The 2011-12 figure is from the ministry's earlier employment survey; later years are from its periodic labour survey, which uses a different design.
Annex A: State results, 2025
Each criterion shows the state's value; shaded cells clear the bar (density 11%, size 4.5, spread 50%, diversity 2). Graduate figures are for ages 22 to 29: unemployment among graduates working or looking for work, and the share of working graduates in jobs below their degree. "Meets target" allows up to 2.5 points on each for sampling error. Capital concentration is the leading city's registered employers as a multiple of the next urban centre; 4 times or more is flagged in bold. States marked * hold less than 1% of India's young people and were not used to set the bars.
| State or UT | Density | Size | Spread | Diversity | Criteria met | Graduates unemployed | Below degree | Meets target | Capital concentration |
|---|---|---|---|---|---|---|---|---|---|
| Gujarat | 12.4% | 7.5 | 61% | 2 | 4 | 7% | 58% | No | 2.0x |
| Maharashtra | 14.9% | 5.5 | 56% | 2 | 4 | 14% | 45% | Yes | 1.9x |
| Karnataka | 12.3% | 4.8 | 60% | 2 | 4 | 15% | 41% | Yes | 9.8x |
| Tamil Nadu | 17.2% | 11.8 | 81% | 4 | 4 | 17% | 47% | Yes | 4.1x |
| Haryana | 20.0% | 8.9 | 55% | 3 | 4 | 21% | 55% | No | 1.7x |
| Puducherry* | 32.4% | 8.4 | 50% | 4 | 4 | 21% | 28% | Yes | 2.0x |
| Goa* | 23.7% | 15.0 | 100% | 1 | 3 | 17% | 33% | Yes | 1.6x |
| Punjab | 11.2% | 4.6 | 36% | 3 | 3 | 23% | 53% | No | 2.4x |
| Kerala | 14.0% | 3.0 | 86% | 4 | 3 | 27% | 34% | No | 2.4x |
| Sikkim* | 9.1% | 6.6 | 75% | 0 | 2 | 8% | 40% | Yes | 1.6x |
| Delhi | 17.9% | 1.6 | 27% | 4 | 2 | 18% | 43% | Yes | n/a |
| Uttarakhand* | 9.8% | 8.4 | 38% | 3 | 2 | 21% | 62% | No | 1.1x |
| West Bengal | 7.5% | 1.7 | 65% | 3 | 2 | 25% | 51% | No | 7.8x |
| Uttar Pradesh | 3.3% | 1.7 | 16% | 2 | 1 | 15% | 78% | No | 2.3x |
| Himachal Pradesh* | 6.3% | 7.8 | 33% | 0 | 1 | 22% | 75% | No | 3.3x |
| Rajasthan | 4.4% | 2.3 | 21% | 3 | 1 | 32% | 75% | No | 4.1x |
| Telangana | 10.4% | 4.6 | 48% | 0 | 1 | 33% | 43% | No | 30.7x |
| Andhra Pradesh | 5.8% | 2.8 | 65% | 1 | 1 | 39% | 54% | No | 1.3x |
| Madhya Pradesh | 3.4% | 1.2 | 21% | 0 | 0 | 12% | 71% | No | 1.5x |
| Chhattisgarh | 5.0% | 1.9 | 24% | 0 | 0 | 17% | 73% | No | 2.0x |
| Tripura* | 2.5% | 1.8 | 12% | 0 | 0 | 17% | 35% | Yes | 7.6x |
| Assam | 6.5% | 1.9 | 6% | 0 | 0 | 29% | 62% | No | 5.7x |
| Jharkhand | 3.3% | 1.0 | 25% | 0 | 0 | 30% | 74% | No | 1.3x |
| Odisha | 4.3% | 1.1 | 34% | 0 | 0 | 32% | 64% | No | 2.4x |
| Bihar | 1.1% | 0.3 | 3% | 0 | 0 | 33% | 79% | No | 5.4x |
| Manipur* | 4.6% | 0.2 | 12% | 0 | 0 | 38% | 70% | No | 5.2x |
| Jammu and Kashmir | 3.2% | 1.3 | 18% | 0 | 0 | 39% | 62% | No | 1.8x |
| Meghalaya* | 2.5% | 0.6 | 17% | 0 | 0 | 40% | 62% | No | 2.7x |
| Mizoram* | 0.2% | 0.0 | 0% | 0 | 0 | 41% | 64% | No | 15.7x |
| Arunachal Pradesh* | 2.9% | 0.6 | 0% | 0 | 0 | 52% | 67% | No | 3.9x |
| Nagaland* | 3.3% | 0.3 | 0% | 0 | 0 | 54% | 68% | No | 3.8x |
The table covers 31 of India's 36 states and Union Territories. Not covered: Andaman and Nicobar Islands, Chandigarh, Dadra and Nagar Haveli and Daman and Diu, Ladakh and Lakshadweep, whose survey samples are too small for these measures. Delhi is a single city, so capital concentration does not apply.
Annex B: Data and method
| Measure | What it counts | Source and year | Level |
|---|---|---|---|
| Graduate unemployment; below-degree share | Graduates aged 22 to 29; occupations below professional, technical and managerial work count as below degree | Ministry of Statistics and Programme Implementation, labour survey 2025 (2017-18 to 2023-24 for earlier years; 2011-12 employment survey) | State |
| Density | Share of workers aged 15 to 59 in private workplaces of 20 or more | Ministry of Statistics and Programme Implementation, labour survey, same years | State |
| Size | Factories in operation with 100 or more people, per lakh population | Ministry of Statistics and Programme Implementation, industrial survey 2023-24 (each year's own for earlier years) | State |
| Spread | Share of districts, and of young people, in districts at or above the India district median on both registered employers per lakh people (about 22) and members per employer (about 38) | Ministry of Labour and Employment, 2023-24 (2021-22 and 2022-23 for earlier years) | District, summed to state |
| Diversity | Non-farm sectors with 10% or more of both state output and workers (shares above 9% rounded up to 10%); at least one manufacturing or a tradable service | Ministry of Statistics and Programme Implementation, state output by sector 2024-25, and labour survey 2025 | State |
| Capital concentration | Registered employers in the leading city, counted as its whole urban agglomeration, as a multiple of the next urban centre | Ministry of Labour and Employment, 2023-24; urban agglomerations from Census 2011 | District |
| Population | Each year's own population at 1 March, for every per-lakh measure and the young-people share | Ministry of Health and Family Welfare projections; Census 2011 for 2011-12 | District and state |
Universe. 31 states and Union Territories, listed in Annex A. The bars rest on the twenty with at least 1% of India's young people; the eleven smaller ones are reported but did not set the bars.
Outcome target. Graduate unemployment at ages 22 to 29 of 20% or less, and no more than half of working graduates in jobs below their degree. Each allows up to 2.5 points, or the state's sampling error if smaller, because differences that small are within what the survey can measure.
Setting the bars. For each criterion we chose the value that best separates the larger states meeting the target from those missing it, pooling 2022-23, 2023-24 and 2025, then rounded density and size down to 11% and 4.5. The bars are now fixed.
Robustness. Dropping any one state from the bar-setting moves the fitted values only slightly: density between 11.4% and 12.4%, size between 4.6 and 5.2, spread between 50% and 52%, diversity not at all. Setting the bars on 2025 alone gives density 12.3%, size 4.8, spread 56% and diversity 2. We also tested other targets. A stricter one, 20% and 40%, left only one larger state meeting it in recent years, too few to set bars. Allowing 2 points on each measure, or 5 points on the below-degree share only, left the same four larger states meeting the target in 2025: Delhi, Karnataka, Maharashtra and Tamil Nadu. In the years not used to set the bars, 2011-12 and 2017-18 to 2021-22, states meeting more criteria have lower graduate unemployment in every year.
Follow our blog to stay updated on our programs and other content ↗