The Top 10% Republic
India has taken welfare to every district. But 10% of districts hold 70% of its economic opportunity.
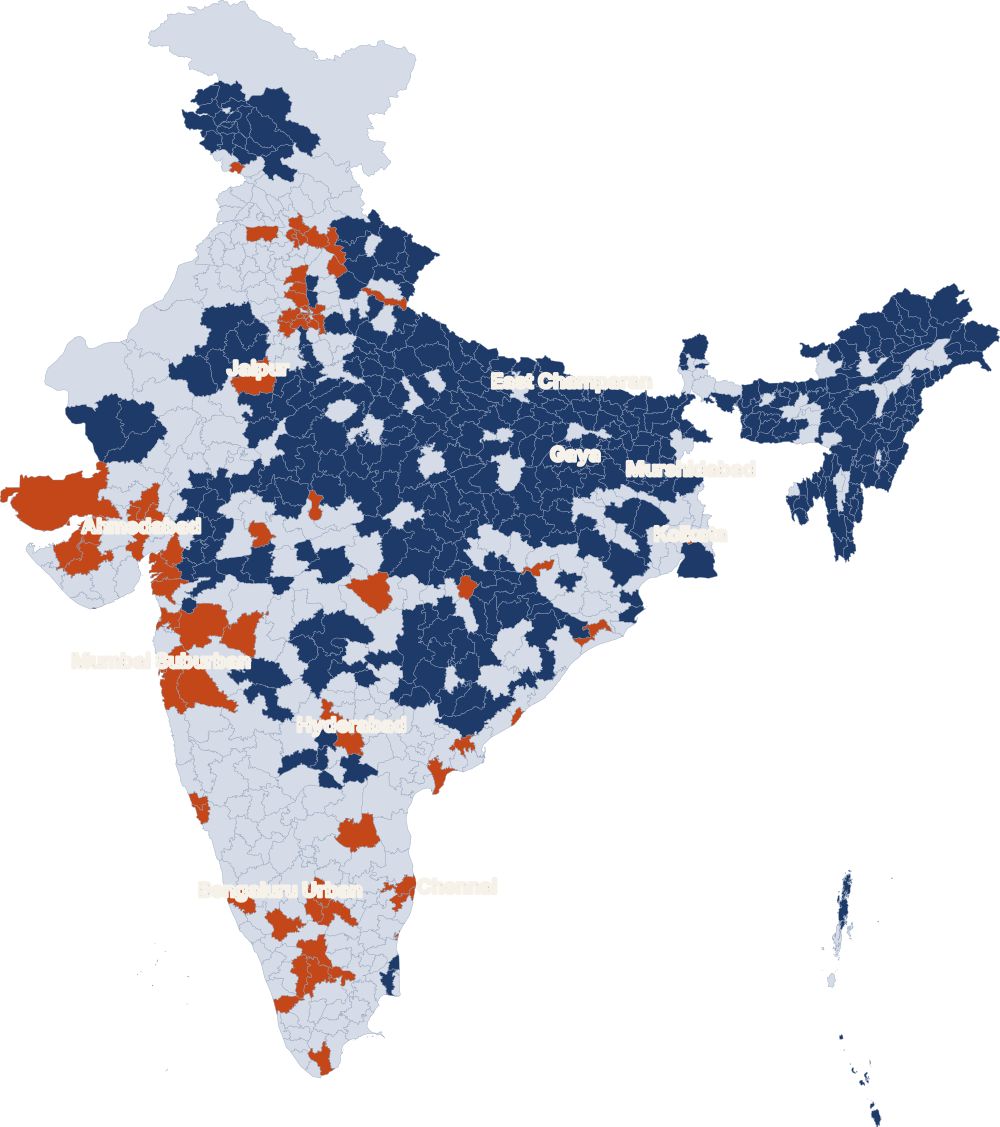
India has about 780 districts, and about 85% of Indians live in the district where they were born. For most people, the district of their birth will shape their life trajectory. That means every district has to offer everyone in it a minimum level of opportunity for a decent life: education, health and work. Today, the top 10% of districts hold 70% of India’s economic opportunity. The bottom half hold about 5%, and the 200 districts at the very bottom about 1%.
One in ten districts holds 70% of India’s economic opportunity
We ranked every district, per person, on four things that together make up economic opportunity: formal employers, access to credit, links to markets beyond the district, and the move from education into work for young people.1
The 78 districts at the top, home to 16% of Indians, hold 66% of bank credit to businesses and farms, 73% of apprentices, 75% of goods exports and 55% of employers registered for provident fund. The 390 at the bottom, home to 41% of Indians, hold about 5%. The 200 at the very bottom, home to nearly one in five Indians, hold about 1%.
The divide is partly regional: almost every district in Bihar and the north-east is in the bottom half. But every state, including the richest, repeats the pattern within its own borders. In Karnataka, four districts led by Bengaluru hold 69% of the state’s economic opportunity with 23% of its people; in Tamil Nadu, four led by Chennai hold 59% with 18%.2
Welfare reaches every district. Opportunity does not
Welfare, from free ration to more than 55 crore Jan Dhan accounts, reaches every district, and covers far more of the people in the bottom half than in the top 10%, as it should: these districts need it most.* Schools and health centres are spread across districts roughly in proportion to the people who live there.3 But credit, apprenticeships, exports and employers have not followed.
So about 80 crore Indians get free ration, while about 8 crore have a Good Job.4
In the bottom 200 districts, the odds of being among India’s top 1% of earners are 1 in 1,000
Earning ₹85,000 a month puts a worker in India’s top 1%. In the top 10% of districts, 1 in 40 workers earns that much; in the bottom 200, 1 in 1,000. Outside government jobs, half of all earners in the bottom half earn ₹10,000 a month or less.5
For a young person in the bottom half, the choice is to leave home or give up on ambition
In the bottom 390 districts, 3 in 100 young workers have a Good Job, against 26 in 100 in the top 78. Nearly half work on farms, one in four as casual labour and one in five in construction.6
But leaving home rarely brings a foothold
The ambitious and the desperate leave. Most cannot get a foothold where they land. In the bottom 200 districts, there are about 53 pupils in classes 9 to 12 for every 100 teenagers, against 85 in the top districts. They arrive without the education, networks and access that better work requires, and end up in jobs like construction and driving. Across India, only 10% of young workers have a Good Job, even with the pay line set as low as ₹20,000 a month, and 65% are in work that offers little chance to move up.7 They live away from their families, often four or more to a room to save money to send home, and have to go back when the work runs out.
The cities that receive them strain under the pressure. This is not the efficiency that concentrating economic activity (what economists call agglomeration) is meant to deliver, but distress and disparity. Concentration works only when every district offers a minimum threshold of opportunity, and when the places where opportunity gathers are porous and accessible to those who arrive.
As Ruchi Gupta, our executive director, has argued, spreading growth is not only a question of equity. It is a condition of democratic legitimacy. When growth concentrates while democracy works at the scale of every district, people take part in politics without that participation improving their lives. That is a republic for the top 10%. India needs to make the district its unit of opportunity, so that every young Indian has the chance to thrive.
Through our Tracking Indian Youth media fellowship, we have published almost 200 profiles of young Indians across 24 states and union territories. Read their stories here.
If you are an MP, read the District Good Jobs Agenda and work with us to build one for your district. If you are a citizen, ask your MP to put youth outcomes on the agenda of your district’s DISHA committee.
Find your district
See where your district stands, its Good Jobs figures, and who chairs its district committee.
See all the districts on the map
How we did this, and notes
1 Each district’s four measures were divided by its population and the ranks averaged; the top 10% is 78 districts, the bottom 50% is 390. Formal employers: establishments registered for provident fund, Ministry of Labour and Employment, 2024. Credit: bank credit to businesses and farms where it is used, Reserve Bank of India, March 2026. Markets: goods exports, Ministry of Commerce and Industry, 2025-26. Education to work: apprentices, Ministry of Skill Development and Entrepreneurship, 2025-26. The bottom 390 hold 6.8% of credit, 3.7% of apprentices, 2.3% of goods exports and 8.3% of employers. The bottom 200 hold 1% of apprentices and 0.3% of goods exports. Head-office counts are not used, and services exports have no district figures. Small-business registrations are not used: registration is free, self-declared and needed for several government benefits, and 99% of registered firms are micro; a business that grows to employ people formally usually registers for provident fund. For exports, newer districts are ranked with their parent district.
2 Economic opportunity is the average of each group’s shares of the four measures. Within states, the same ranking is read inside each state: in every state with 10 or more districts, its top tenth of districts hold a larger share of its economic opportunity than of its people.
* Ministry of Rural Development’s DISHA dashboard: free ration reaches about 6 in 10 people in the bottom half and about 4 in 10 in the top 10% (2026-27); Jan Dhan accounts per person are about 1.7 times higher (accounts opened to July 2024, not people). Jan Dhan total: Ministry of Finance, August 2025.
3 Teachers in government and government-aided schools, Ministry of Education, 2024-25 (top 78: 11%, bottom 390: 45%); teachers, not schools, because 37% of public schools have two teachers or fewer. Health centres and hospitals, Ministry of Health and Family Welfare, March 2025 (top 78: 15%, bottom 390: 38%).
4 Free ration: Department of Food and Public Distribution, March 2026. Good Jobs: 8 crore of India’s 55 crore workers aged 15 to 59 meet YouthPOWER’s Good Job test, applied to Ministry of Statistics and Programme Implementation data, 2025.
5 Earnings reported by workers aged 15 to 59, Ministry of Statistics and Programme Implementation, 2025. Top 1%: at or above the 99th percentile of earners; odds count all workers. Government jobs: government, public-sector and autonomous-body employers.
6 Young workers aged 15 to 29 living in these districts, Ministry of Statistics and Programme Implementation, 2025.
7 Gross enrolment ratio for classes 9 to 12 (pupils of any age, per 100 people aged 14 to 17), Ministry of Education, 2024-25. Good Jobs and work with little chance to move up: all young workers in India, 2025.
8 Survey figures place workers by residence; those the survey does not place in a district are spread across their region by population. Delhi’s credit is divided among its districts by bank branches; Mumbai’s includes some lending used elsewhere. Shares are rounded. Meluri (Nagaland) is not on the map.