How the economy's shape changed
85% of India's workers are in sectors where the median pay is ₹15,000 a month or less. Growth did not create better jobs.
The first piece described how the promise of better jobs through college education is starting to fray. This column unpacks the sectoral shift over the last 30 years and the impact on job quality and pay.
Agriculture lost 12 points of the economy. Manufacturing lost 3.
Between 1993-94 and 2023-24, agriculture lost almost 11.7 points of the economy, falling from 29% to 18%. Instead of absorbing people leaving the fields, manufacturing too lost share, going from 17% to 14%.
Six sectors gained. Property and professional services, up 4.8 points. Trade and hospitality, up three. Construction, up nearly three. Education, health and personal services, up two and a half. Finance, up not quite two. Public administration, up four hundredths of a point.
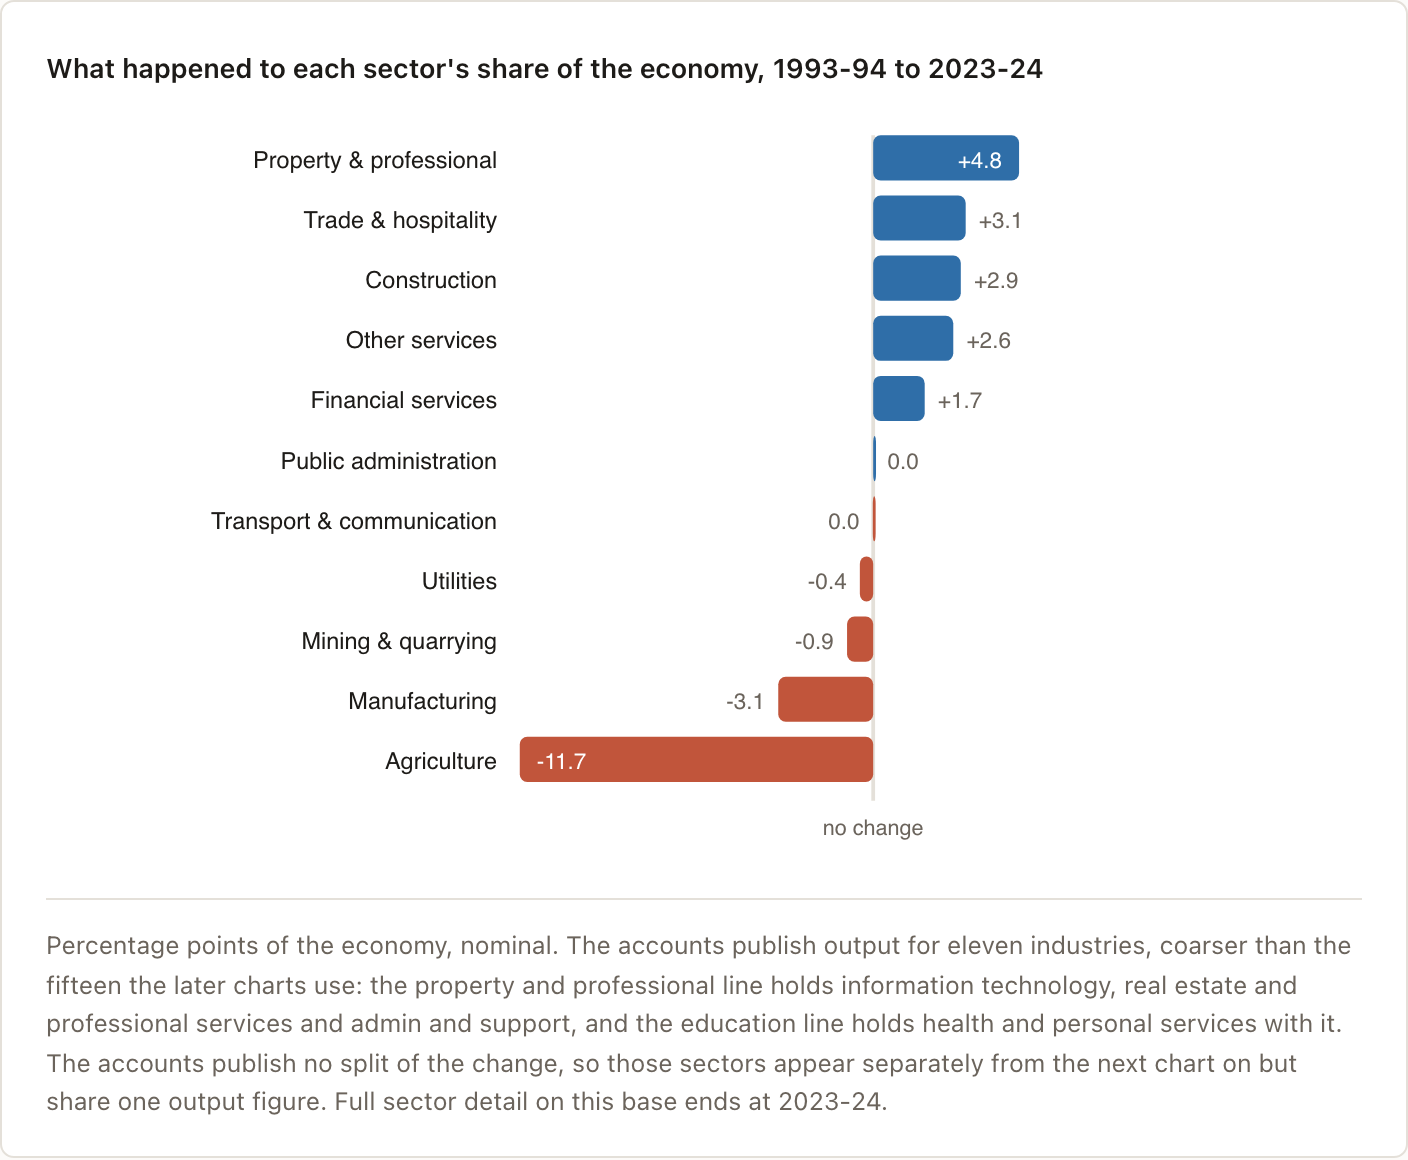
Percentage points of the economy, nominal. The accounts publish output for eleven industries, coarser than the fifteen the later charts use: the property and professional line holds information technology, real estate and professional services and admin and support, and the education line holds health and personal services with it. The accounts publish no split of the change, so those sectors appear separately from the next chart on but share one output figure. Full sector detail on this base ends at 2023-24.
The two biggest sectors that grew are 82% casual or self-employed
Those gaining sectors hold 213 million workers. 62% of them are not in a regular job.
Trade and hospitality holds 70 million, two thirds of them self-employed. Construction employs 62 million, of which 80% are casual workers. Together that is 132 million people, one in four of all employed.
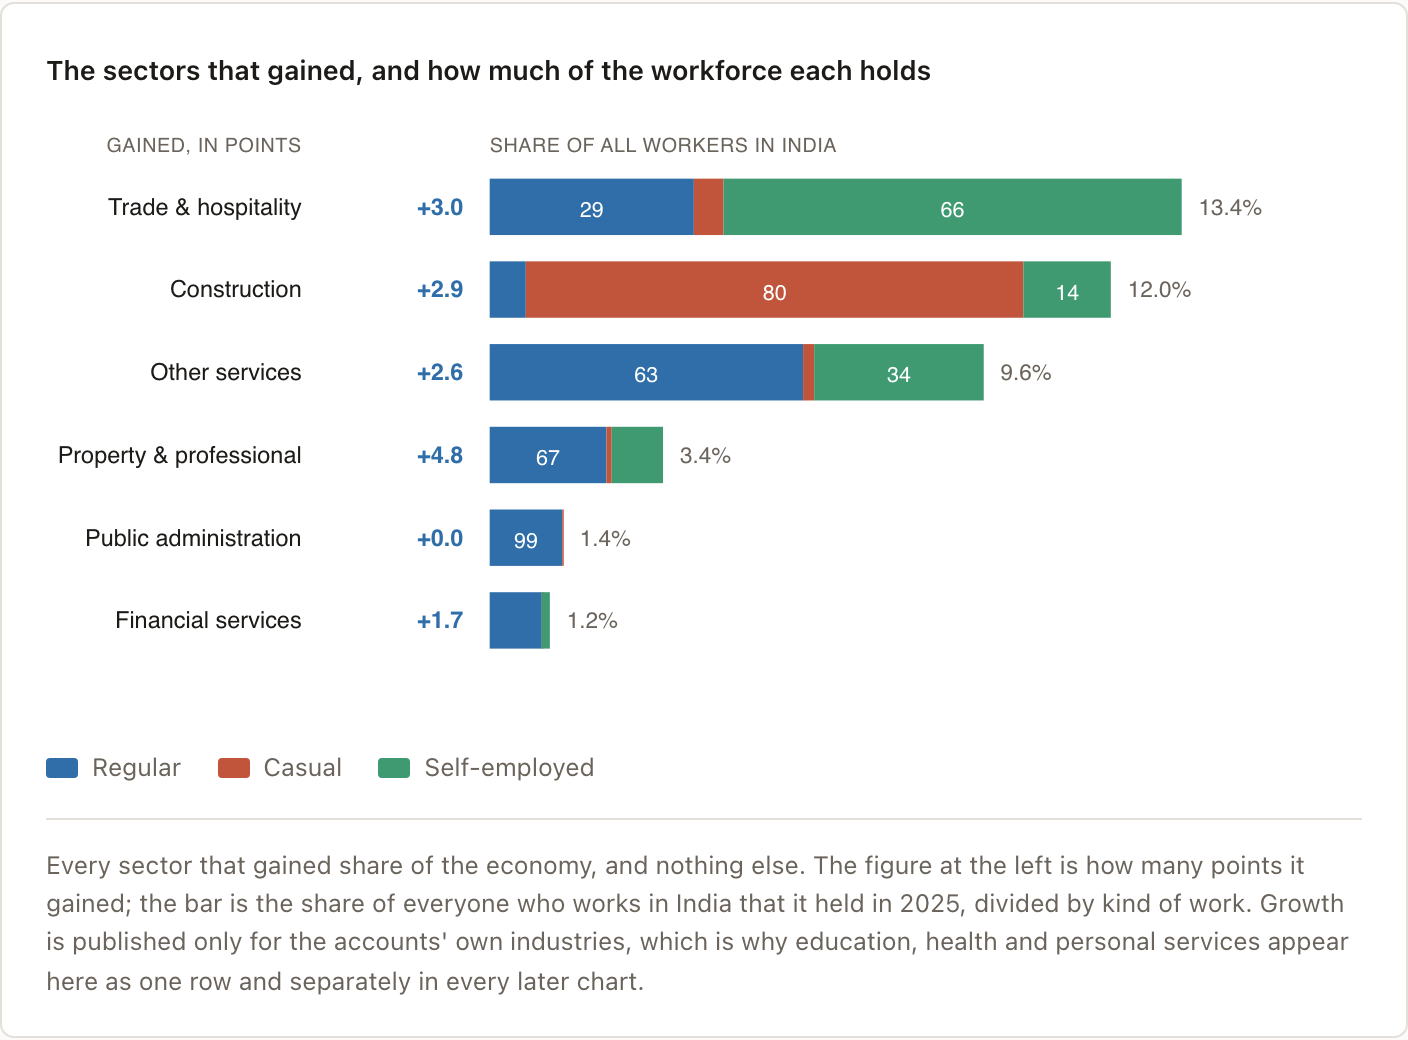
Every sector that gained share of the economy, and nothing else. The figure at the left is how many points it gained; the bar is the share of everyone who works in India that it held in 2025, divided by kind of work. Growth is published only for the accounts' own industries, which is why education, health and personal services appear here as one row and separately in every later chart.
Only 24% of India's workers have a regular job
Agriculture is still the biggest sector at 223 million people, and only 1.2% hold a regular job.
Regular work is the majority in nine of the fifteen sectors, and those nine employ 21% of the workforce between them. The most secure are among the smallest: public administration is 99% regular and holds 7 million people, information technology 88% and 6 million, education 88% and 17 million, health 87% and 8 million, finance 86% and 6 million.
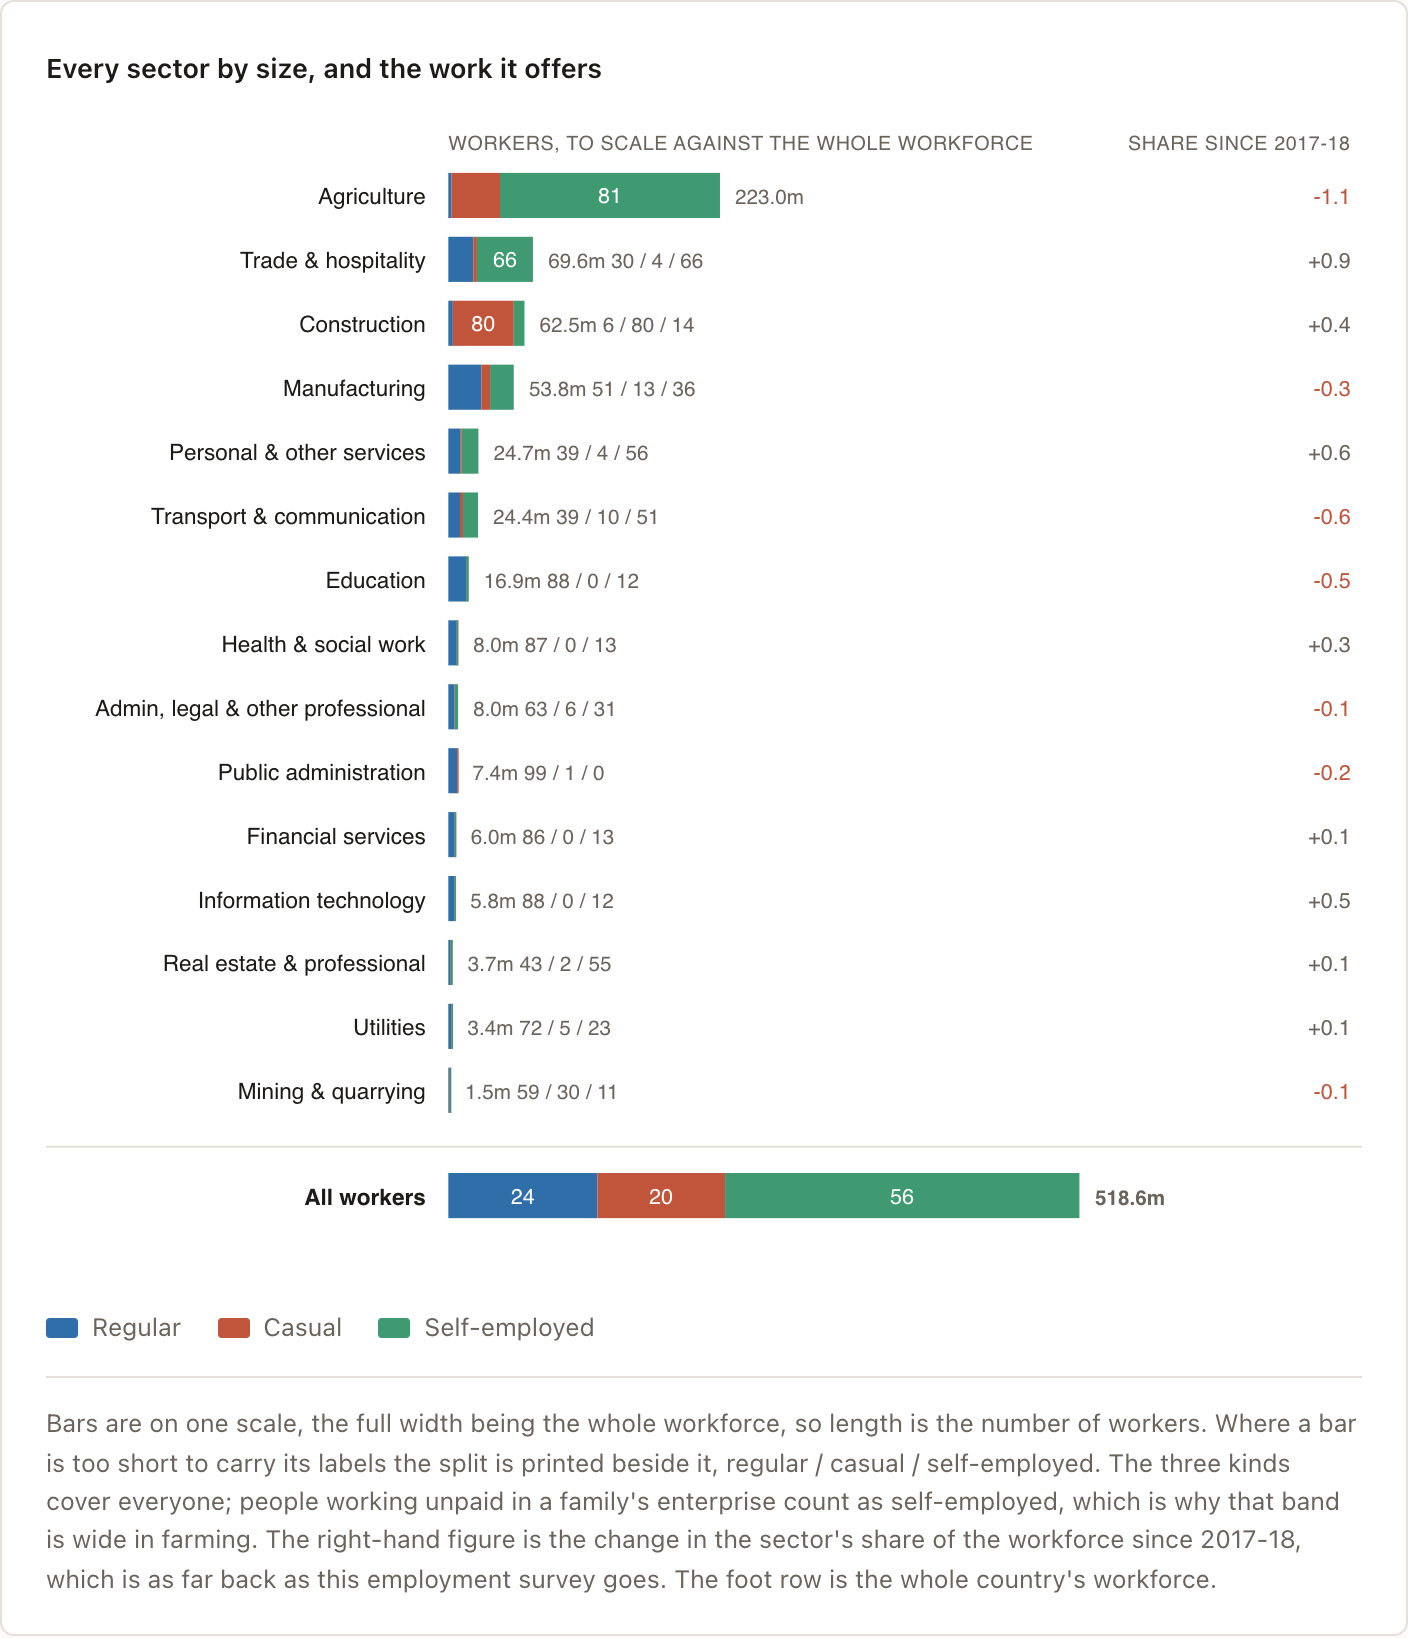
Bars are on one scale, the full width being the whole workforce, so length is the number of workers. Where a bar is too short to carry its labels the split is printed beside it, regular / casual / self-employed. The three kinds cover everyone; people working unpaid in a family's enterprise count as self-employed, which is why that band is wide in farming. The right-hand figure is the change in the sector's share of the workforce since 2017-18, which is as far back as this employment survey goes. The foot row is the whole country's workforce.
Sectors paying ₹15,000 or less hold 85% of the workforce
In 2025 the median worker earns ₹8,400 a month in agriculture, ₹8,500 in personal services, ₹12,000 in construction, ₹14,000 in manufacturing, and ₹15,000 in both trade and hospitality and health and social work.1
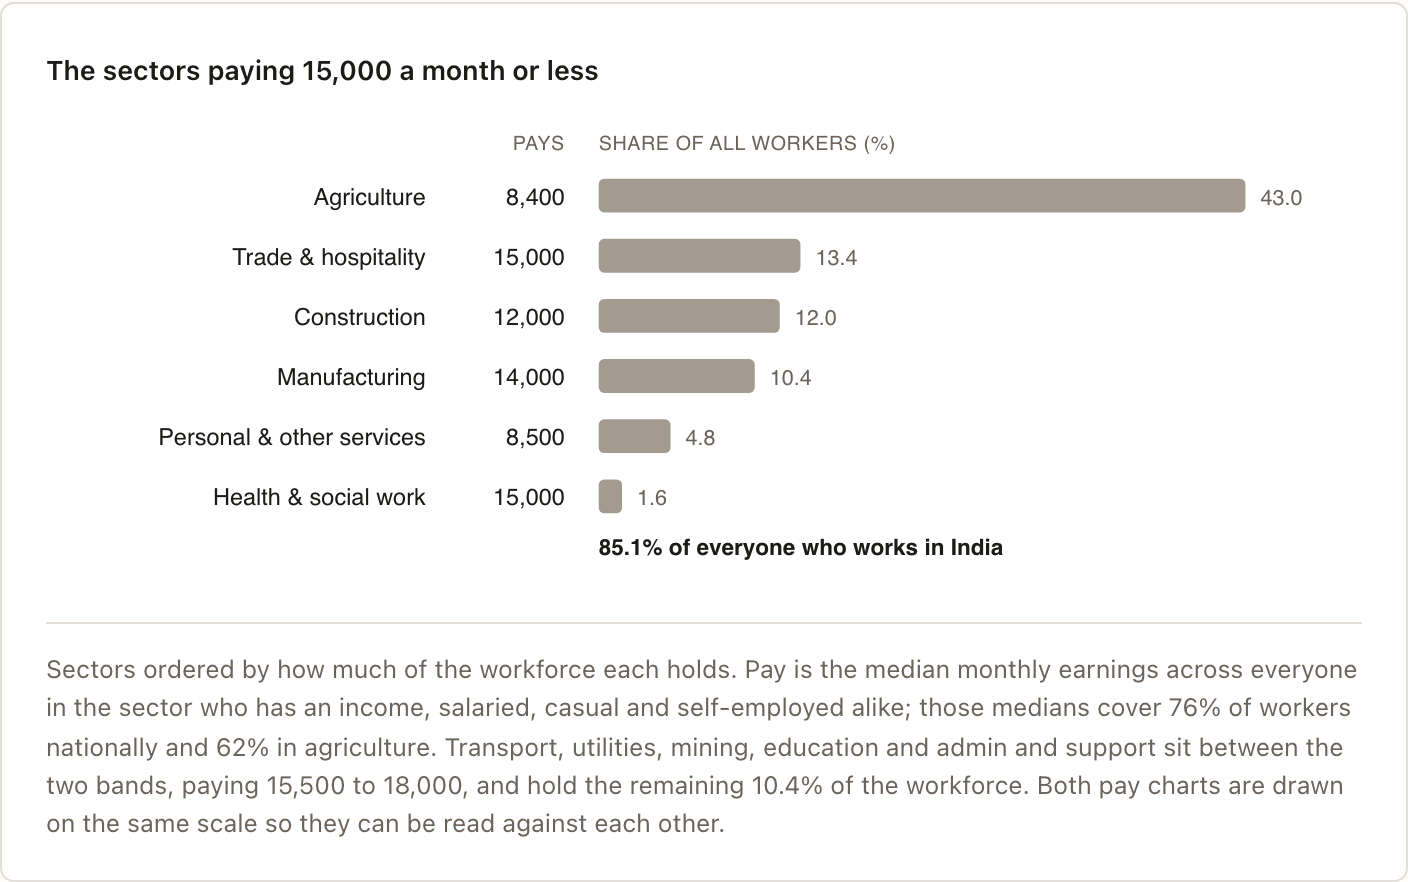
Sectors ordered by how much of the workforce each holds. Pay is the median monthly earnings across everyone in the sector who has an income, salaried, casual and self-employed alike; those medians cover 76% of workers nationally and 62% in agriculture. Transport, utilities, mining, education and admin and support sit between the two bands, paying 15,500 to 18,000, and hold the remaining 10.4% of the workforce. Both pay charts are drawn on the same scale so they can be read against each other.
Only 4% of the workforce is in sectors with median pay of ₹25,000 or more
₹40,000 in information technology, ₹32,320 in public administration, ₹26,000 in real estate and professional services, ₹25,000 in finance. Together they employ 23 million people.
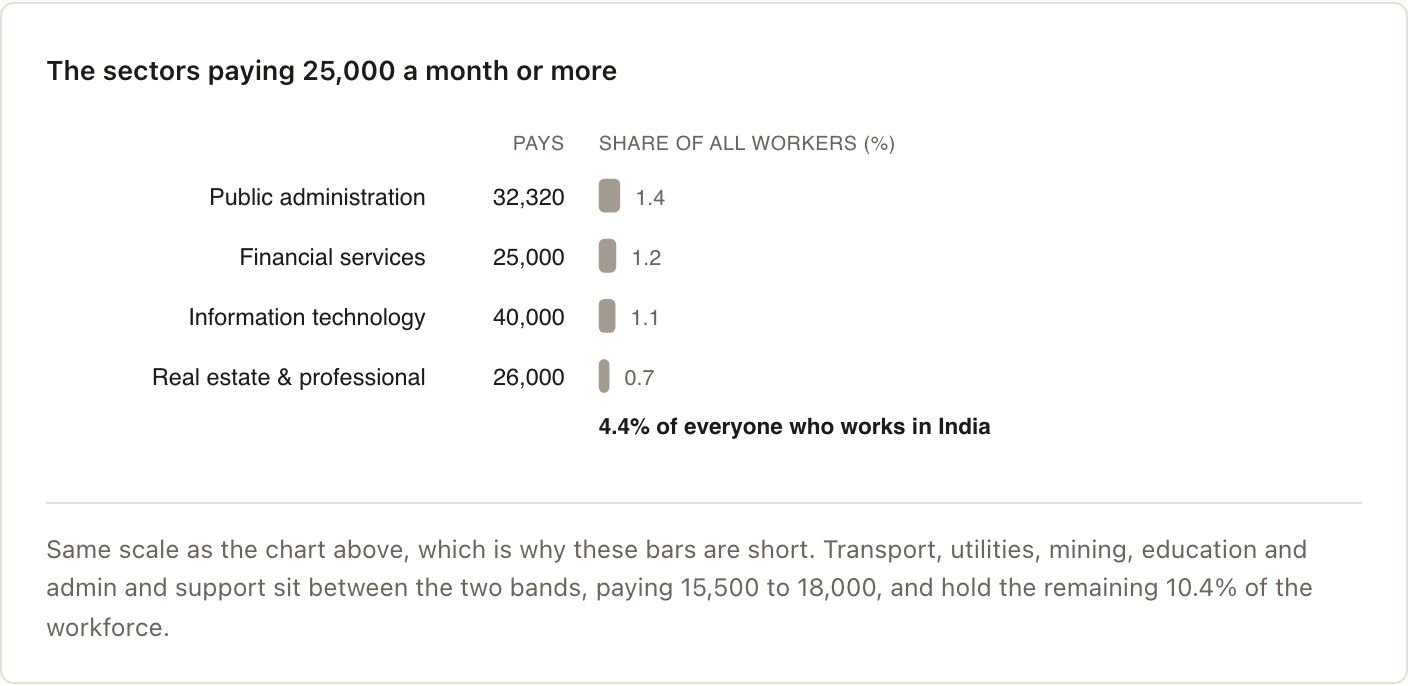
Same scale as the chart above, which is why these bars are short. Transport, utilities, mining, education and admin and support sit between the two bands, paying 15,500 to 18,000, and hold the remaining 10.4% of the workforce.
Pay rose 12% to 17% in the biggest sectors but still ends at ₹15,000 or less
Construction rose 12% and pays ₹12,000 a month. Manufacturing rose 15% and pays ₹14,000. Trade rose 17% and pays ₹15,000. Those three hold 80% of the workers in every sector where pay went up.
Two sectors rose to somewhere better: information technology, 12% to ₹40,000, and public administration, 3% to ₹32,320. Between them they employ 3% of the workforce. Transport and communication rose 9%, to ₹15,500, just over the line. Admin, legal and other professional services rose 5%, to ₹18,000. Mining rose most of all, 24%, but employs only 1.5 million people.
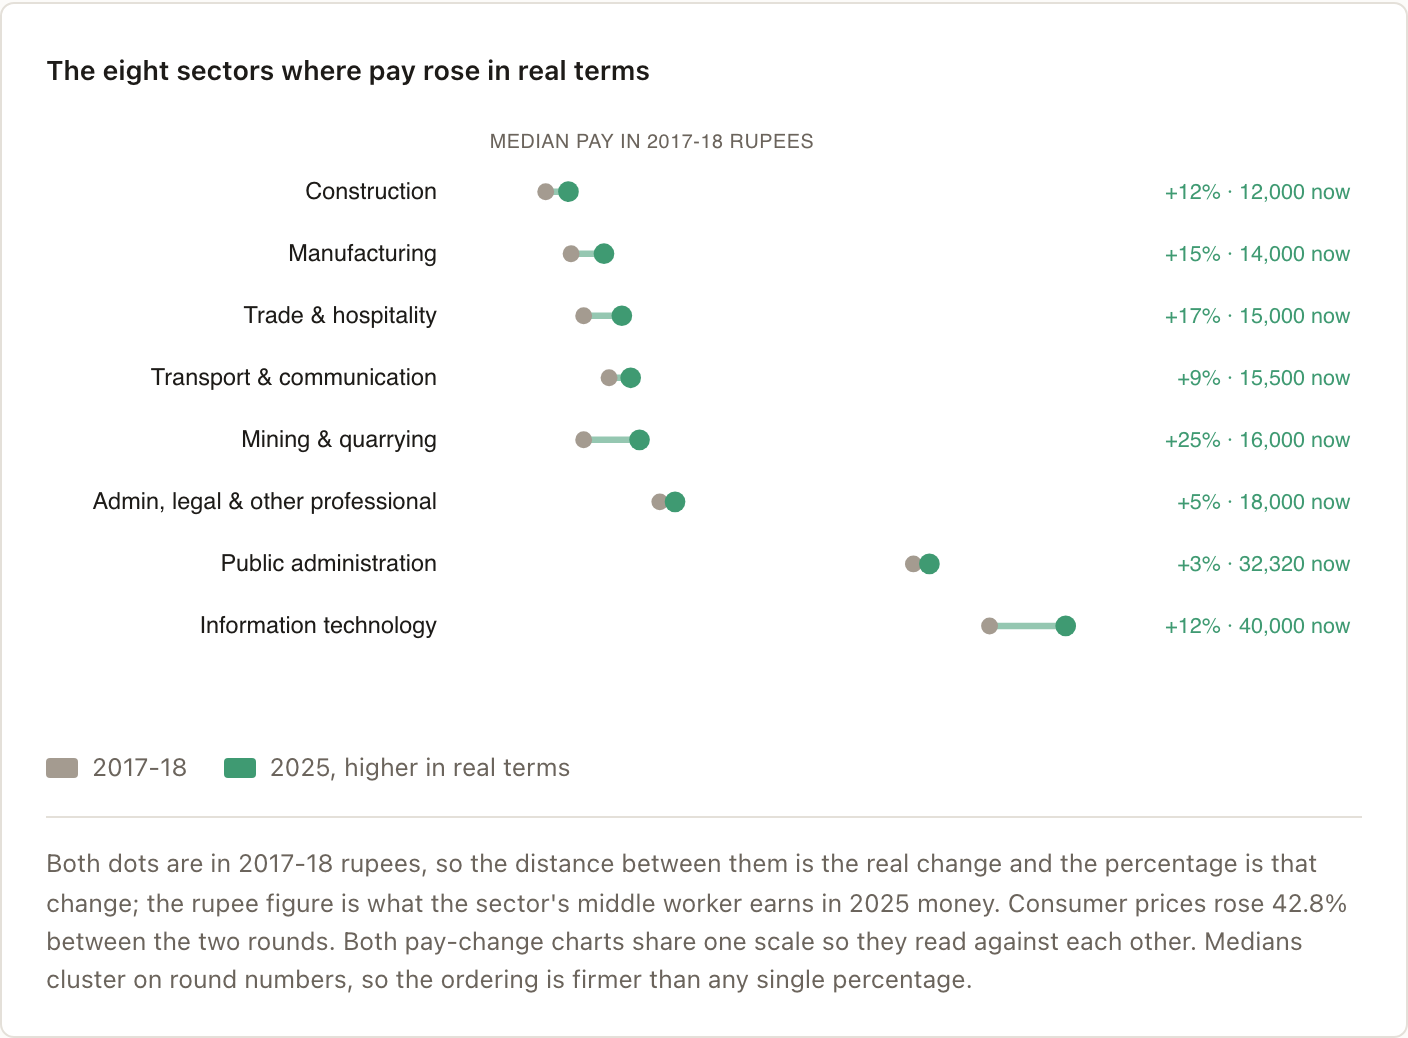
Both dots are in 2017-18 rupees, so the distance between them is the real change and the percentage is that change; the rupee figure is what the sector's middle worker earns in 2025 money. Consumer prices rose 42.8% between the two rounds. Both pay-change charts share one scale so they read against each other. Medians cluster on round numbers, so the ordering is firmer than any single percentage.
Education pays 11% less in real terms than it did in 2017-18
Its median is ₹16,500 against ₹13,000 in 2017-18, while prices rose 42.8%. Real estate and professional services fell 9%, utilities 8%, health 5%, finance 3%. Agriculture fell 2% and personal services 0.8%; between them they employ 48% of the workforce. Together these seven sectors employ 55% of everyone who works in India.
In two of the four best-paying sectors, real pay fell: real estate and professional services by 9% and finance by 3%. The other two, information technology and public administration, rose.
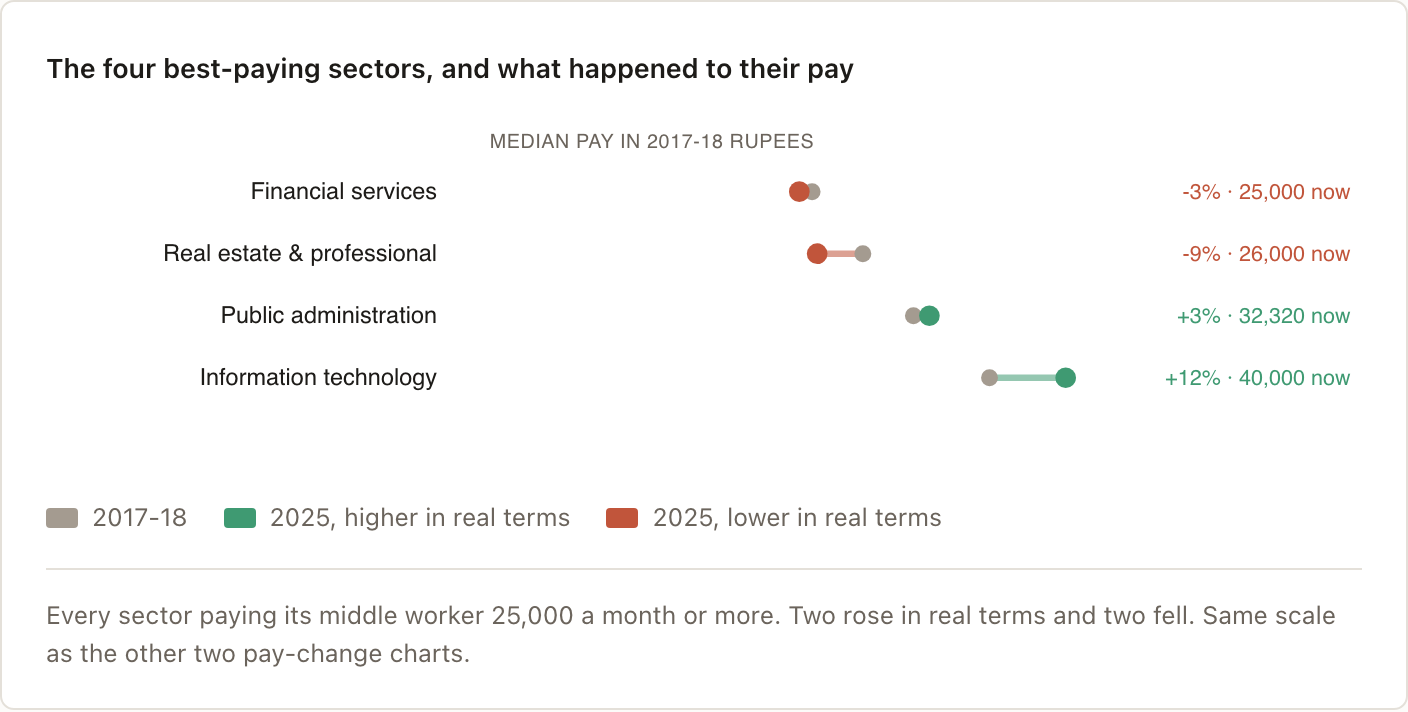
Every sector paying its middle worker 25,000 a month or more. Two rose in real terms and two fell. Same scale as the other two pay-change charts.
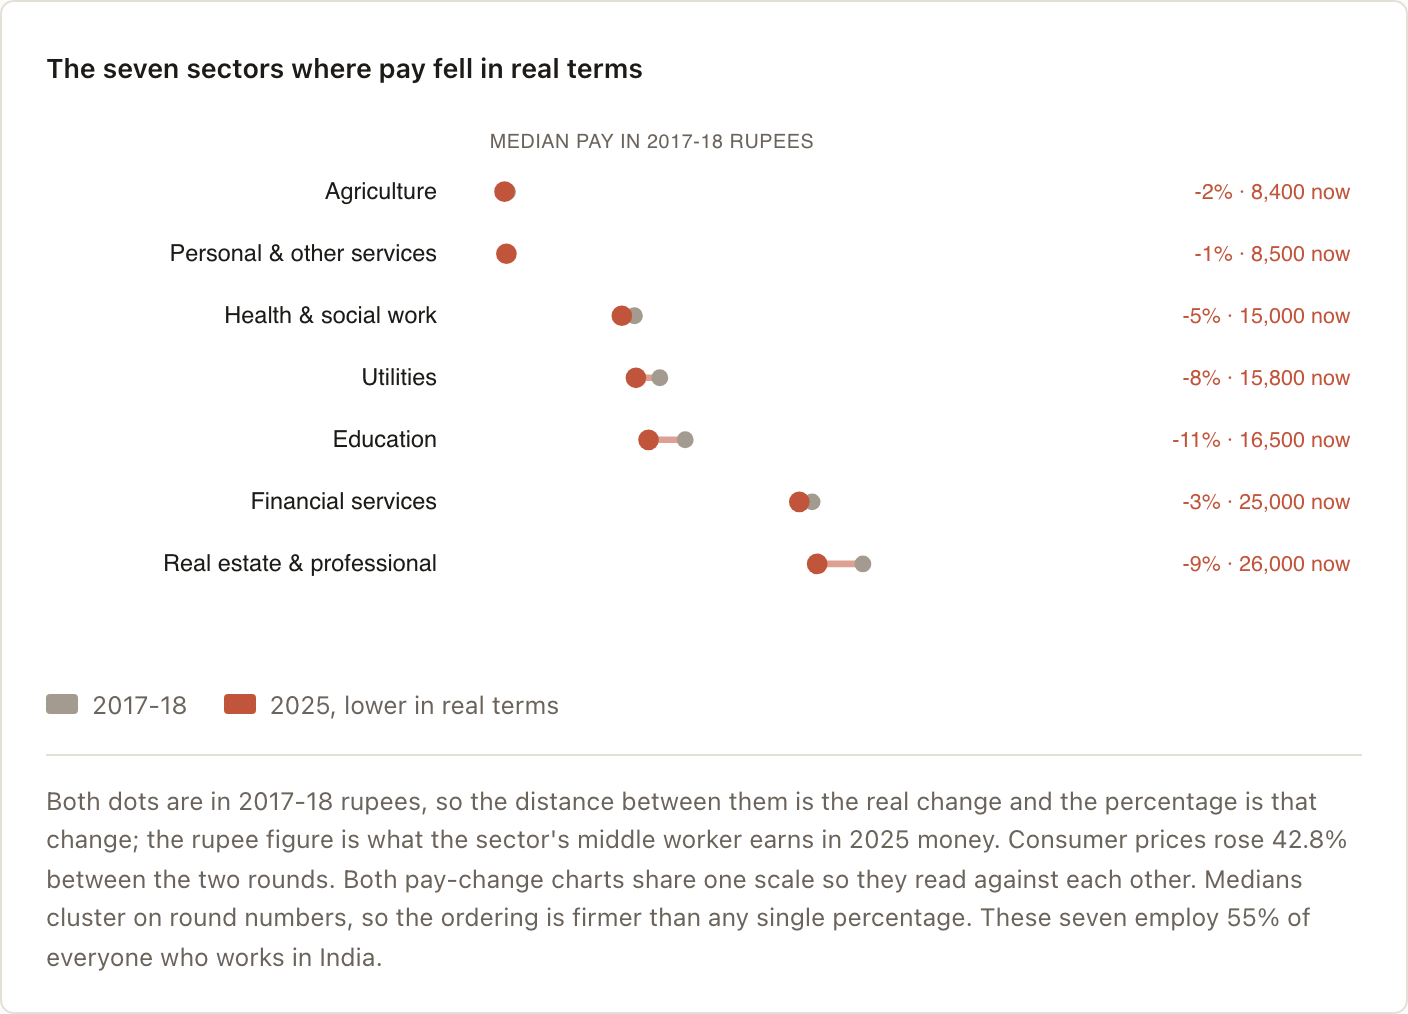
Both dots are in 2017-18 rupees, so the distance between them is the real change and the percentage is that change; the rupee figure is what the sector's middle worker earns in 2025 money. Consumer prices rose 42.8% between the two rounds. Both pay-change charts share one scale so they read against each other. Medians cluster on round numbers, so the ordering is firmer than any single percentage. These seven employ 55% of everyone who works in India.
What this means
Value moved out of agriculture. Its workers did not. Agriculture produced 18% of the economy in 2023-24, down from 29% thirty years earlier, and it still employs 43% of everyone who works.
The sectors that grew did not lead to better jobs or pay. In trade and construction, the next two biggest employers after agriculture, only 18% of workers have a regular job. And in the sectors where pay did rise, four in five of those workers are in ones that still pay ₹15,000 a month or less.
The task in front of us is to ensure not only that we move surplus labour away from farms, but that the movement leads to better jobs and pay.
Notes
Footnotes
-
The middle worker means the median across everyone in the sector whose earnings the survey records, whether salaried, casual or self-employed. ↩