Who is middle class in India, and why do they feel squeezed?
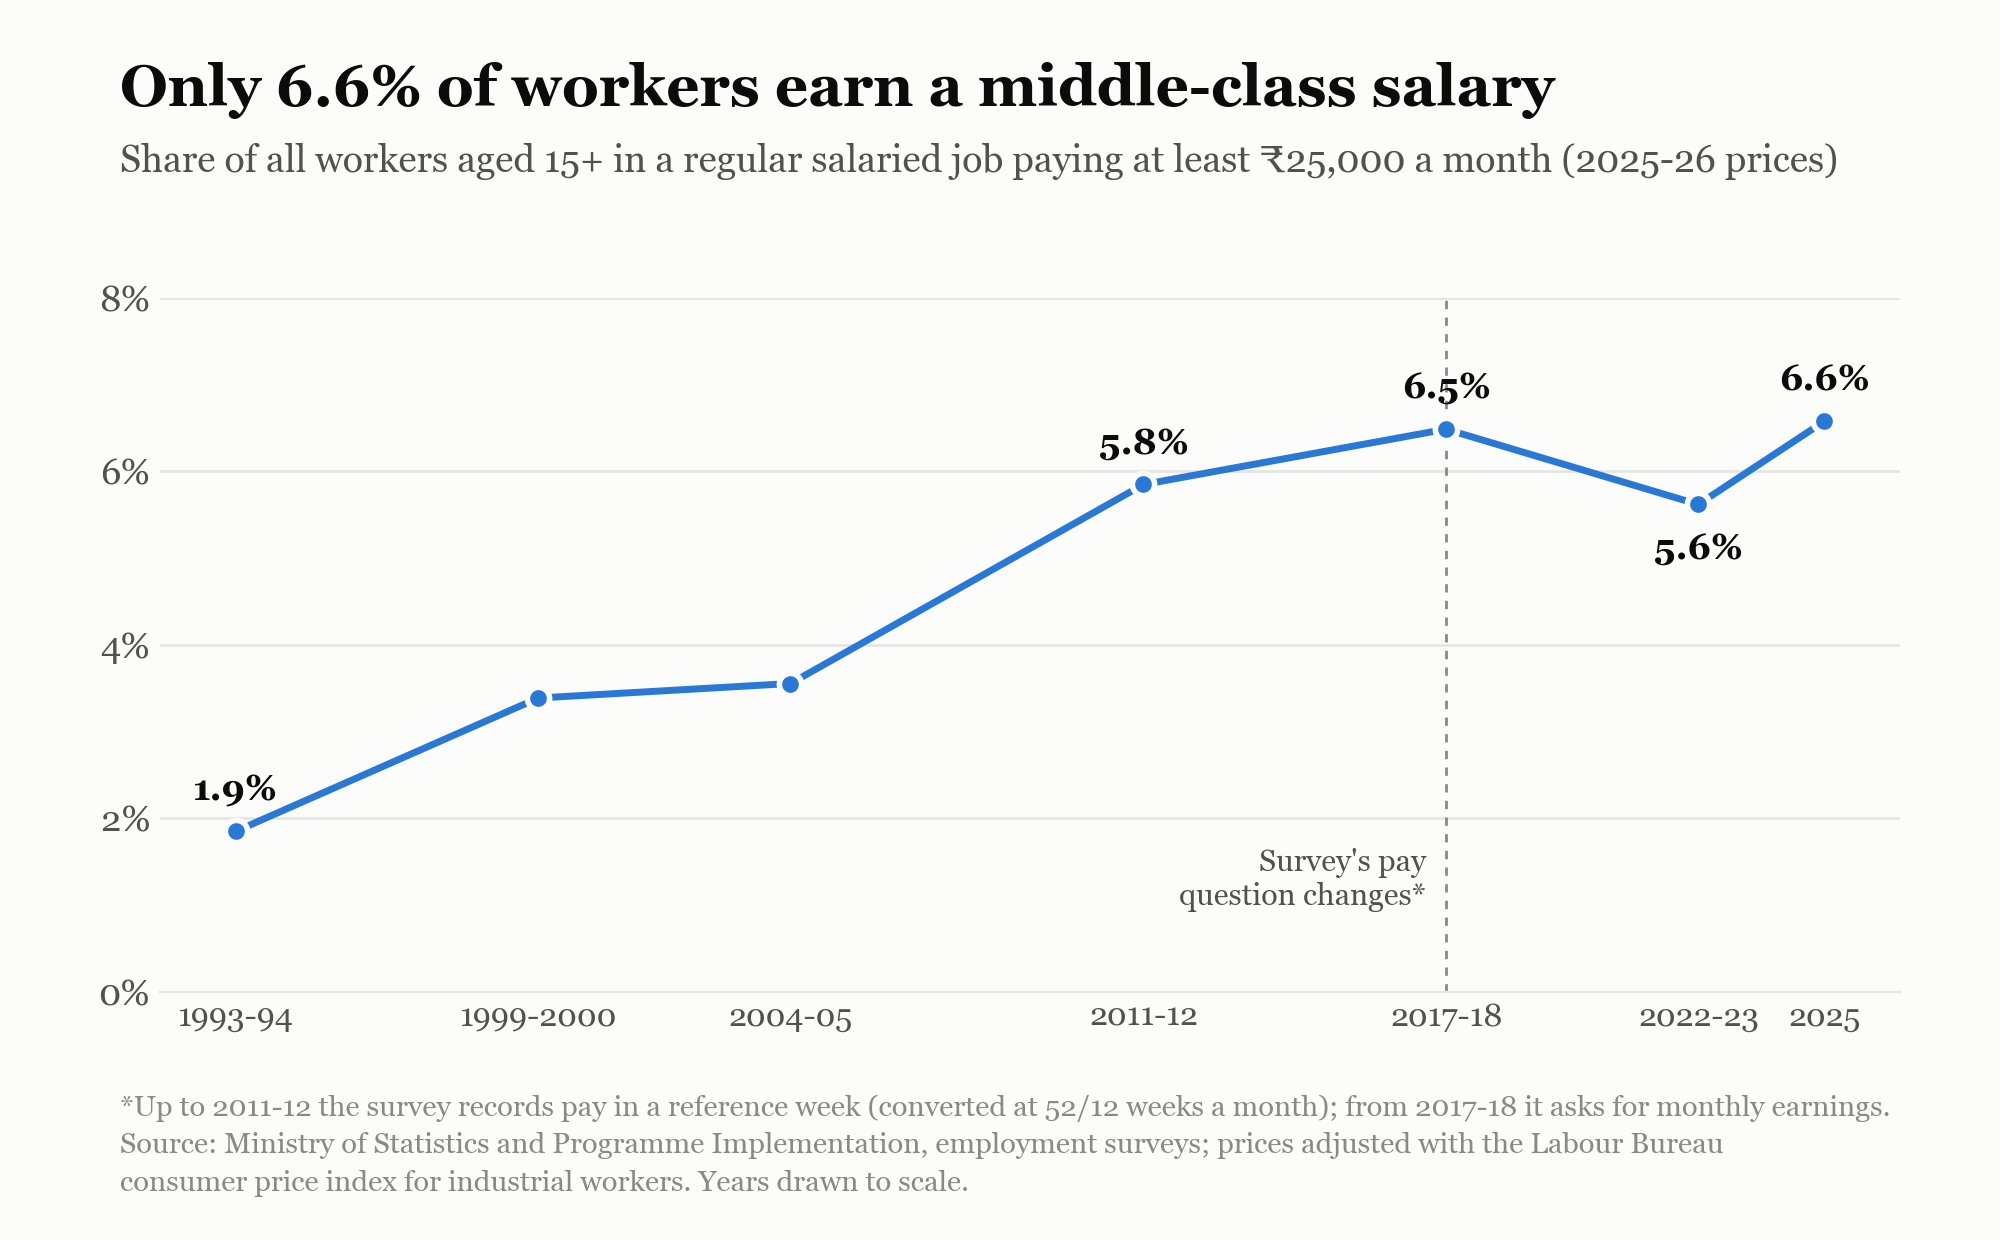
Only 6.6% of Indian workers earn a middle-class salary and the salary buys less than it once did.
Topics: Middle class · Jobs
In 2022-23, an income of ₹25,000 a month put you in the top 10% of Indian adults.¹ That was less than a government peon's starting pay.² By income rank, it takes very little to look well off in India.
A top-10% rank makes a modest income sound rich. But what this income implies is more basic: stable work, the means to meet an unexpected expense, and a prospect of moving up. This is not affluence. It is what most people think of as middle class.
So we count as middle class anyone in a regular salaried job paying at least ₹25,000 a month at today's prices: the ₹25,000 line. The self-employed, about half of India's workers in every survey since 1993-94, are left out. The surveys did not record their earnings before 2017-18, and since then those earnings cannot be separated from the returns to their business. We trace this line through seven national employment surveys, from 1993-94, shortly after liberalisation, to 2025.
6.6% of workers, barely more than in 2017-18
In 1993-94, only 1.9% of India's workers cleared this line. By 2011-12 the share had risen to 5.8%, and by 2017-18 to 6.5%. It dipped to 5.6% in 2022-23, below its 2011-12 level,³ and was back at 6.6% in 2025. Nearly all the increase came before 2017-18. Since then the share has barely risen. Salaried workers grew from 13% of all workers in 1993-94 to 23% in 2017-18, then barely at all.
Where middle-class jobs come from
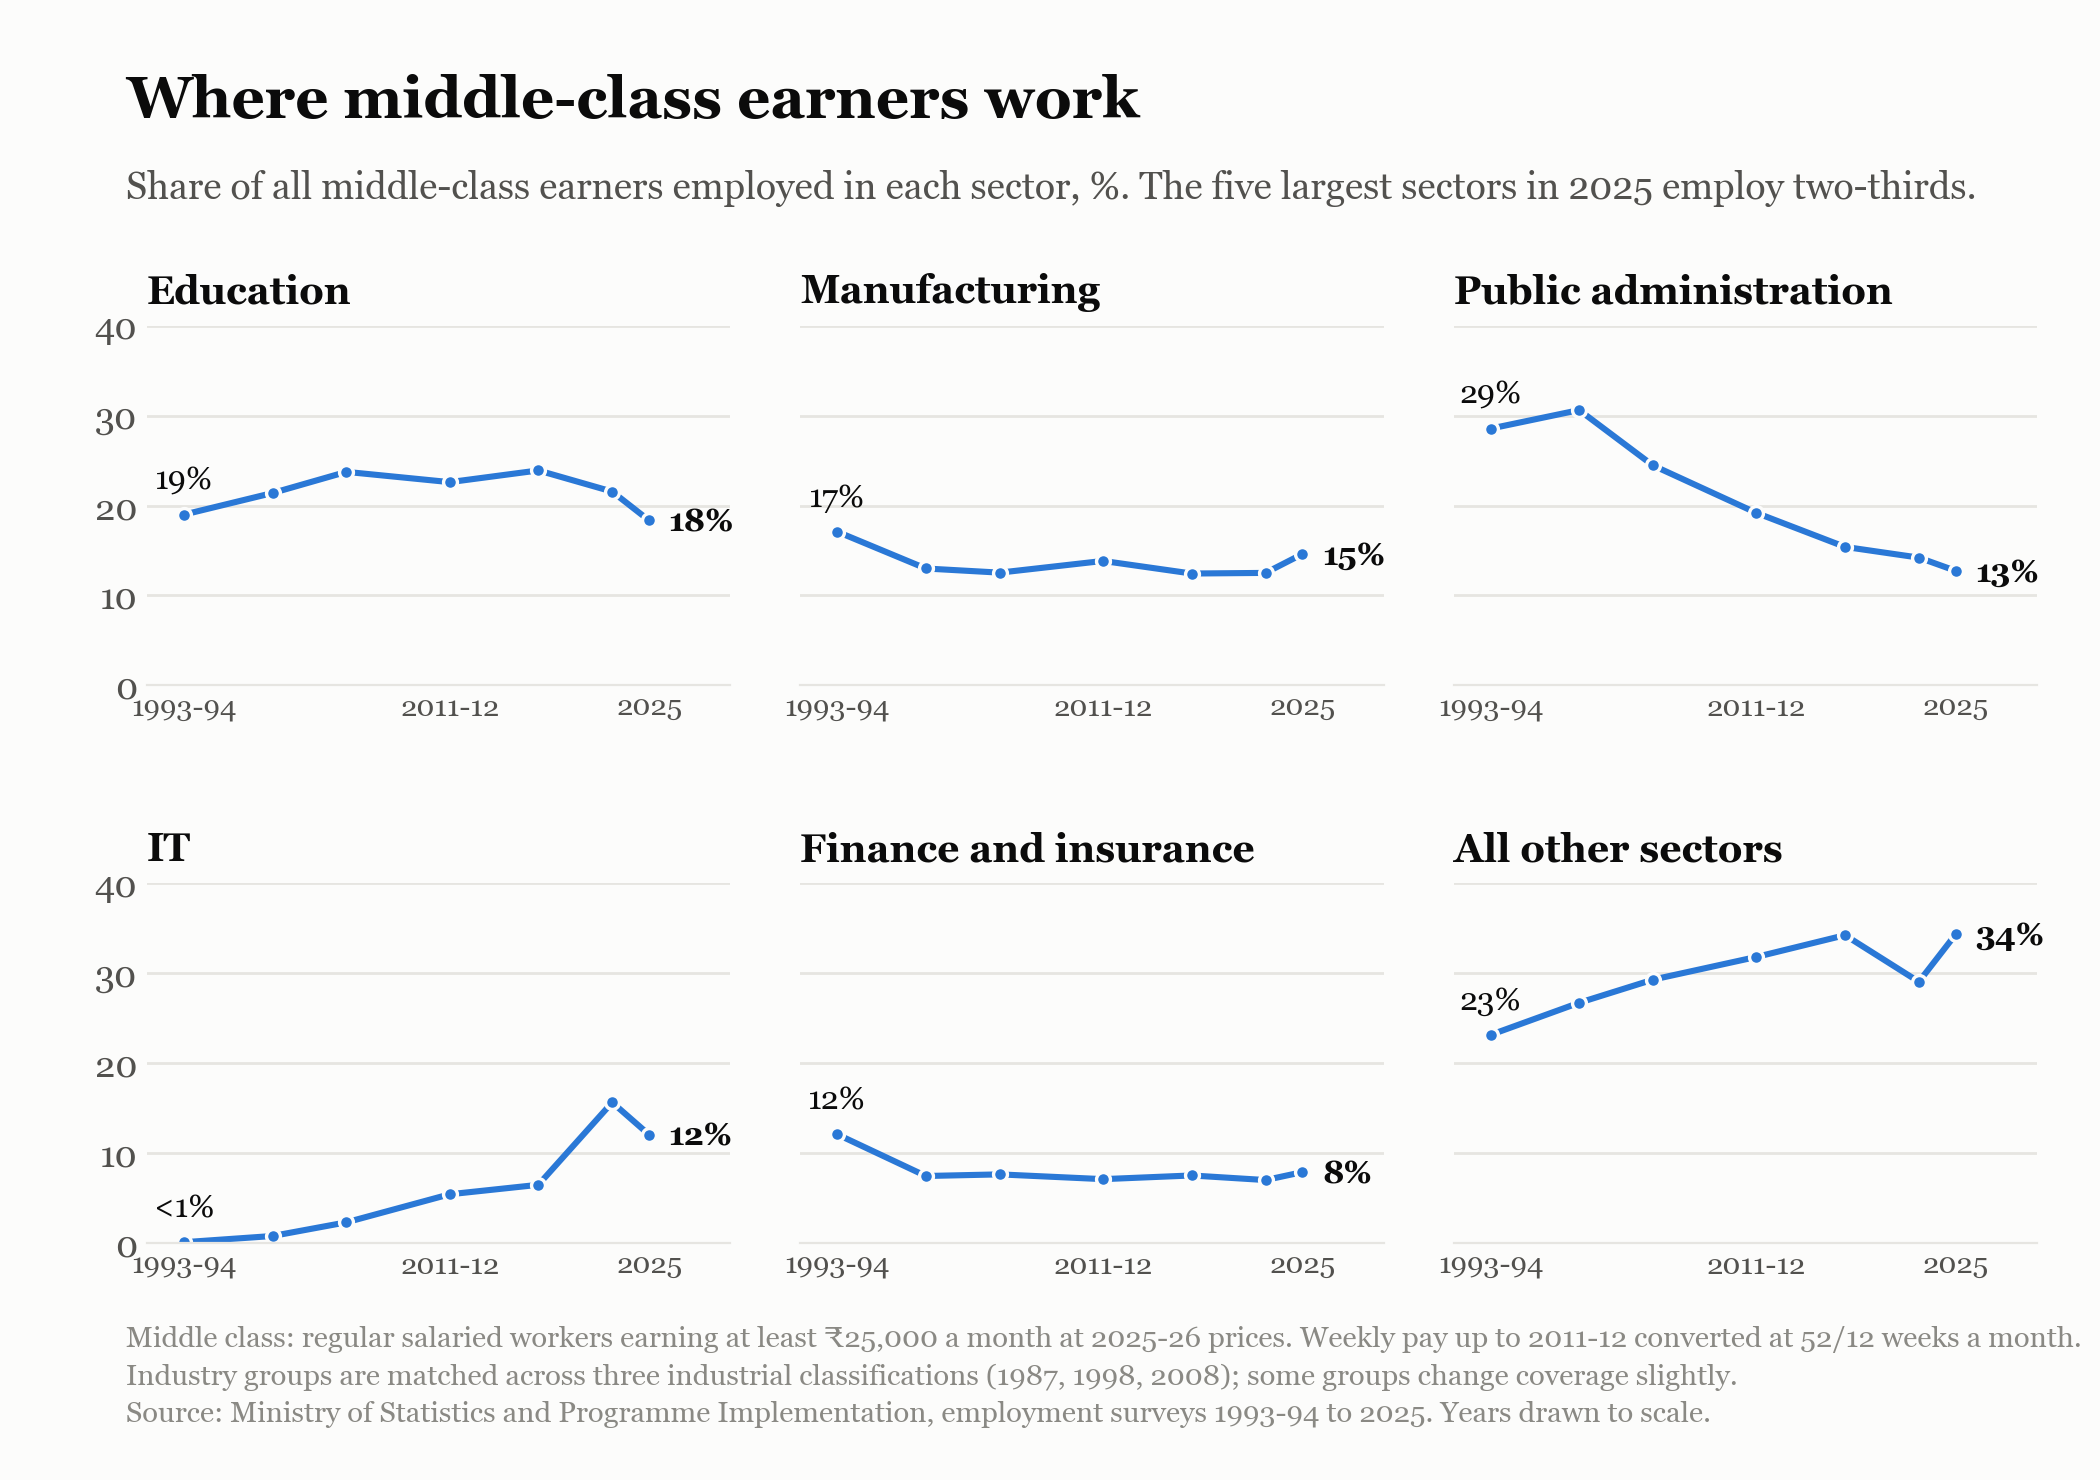
The sources of these jobs have also changed. In 1993-94, public administration alone employed almost 29% of everyone earning a middle-class salary, more than any other sector. By 2025 its share had fallen below 13%, behind education and manufacturing. IT, which barely registered in 1993-94, now accounts for 12%, close behind public administration.
Fewer than three in ten salaried workers earn a middle-class wage
The line rises with inflation, so the share can grow only if salaried work grows faster than other work, or if more salaried workers earn above the line. Since 2017-18, neither has happened. Salaried workers went from 23% of all workers to 24%, and the share of them earning above ₹25,000 at today's prices stayed at about 28%.
Among the five sectors that employ most middle-class earners, it fell in education (45% to 42%), public administration (62% to 60%) and finance (56% to 52%), and rose in IT (74% to 81%) and manufacturing (16% to 18%).
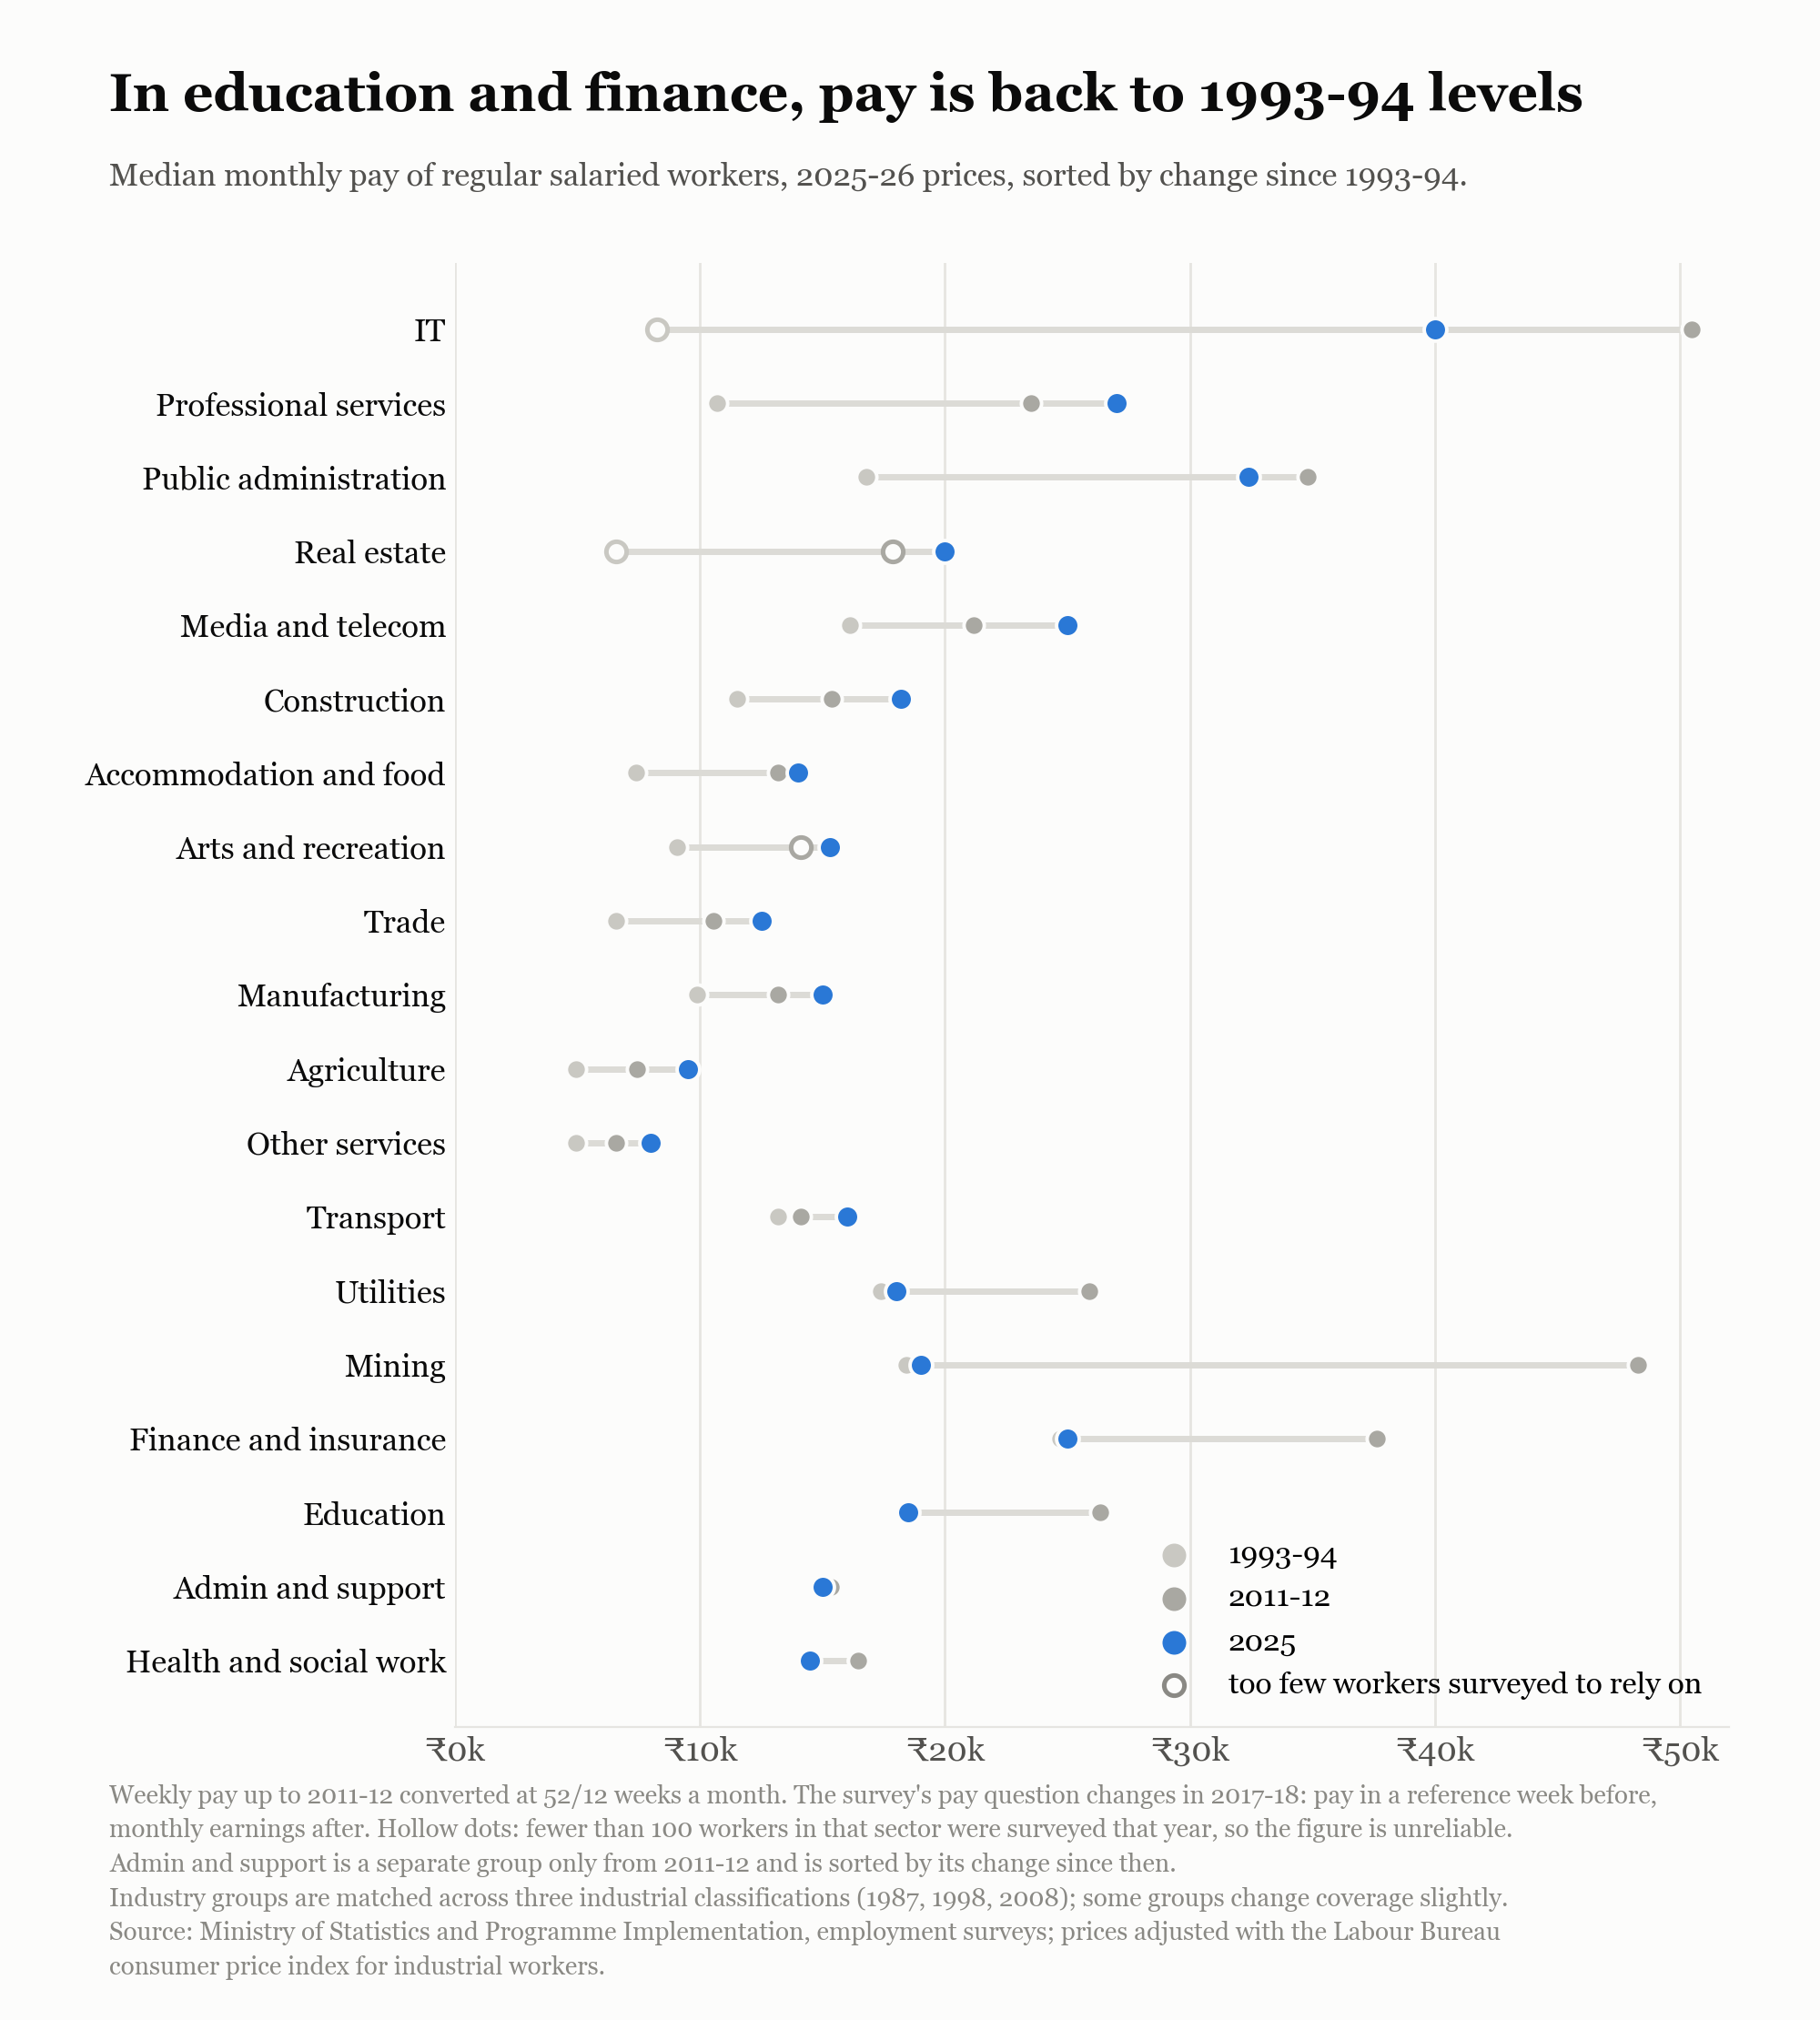
Over the longer run, typical pay in education and finance at today's prices is back where it was in 1993-94.³ Public administration pay doubled from about ₹16,800 in 1993-94 to ₹34,800 in 2011-12, at today's prices, and has since slipped about 7%, to ₹32,400.
Why does the middle class feel squeezed?
Adjusting for inflation only shows whether pay kept up with the price of everyday goods. It doesn't show whether pay kept up with what middle-class families aspire to own. There are many such aspirations; to illustrate, we take two: a house and gold. Both have risen faster than a middle-class salary. That explains part of the squeeze.
Gold: from 12 grams a month to 2
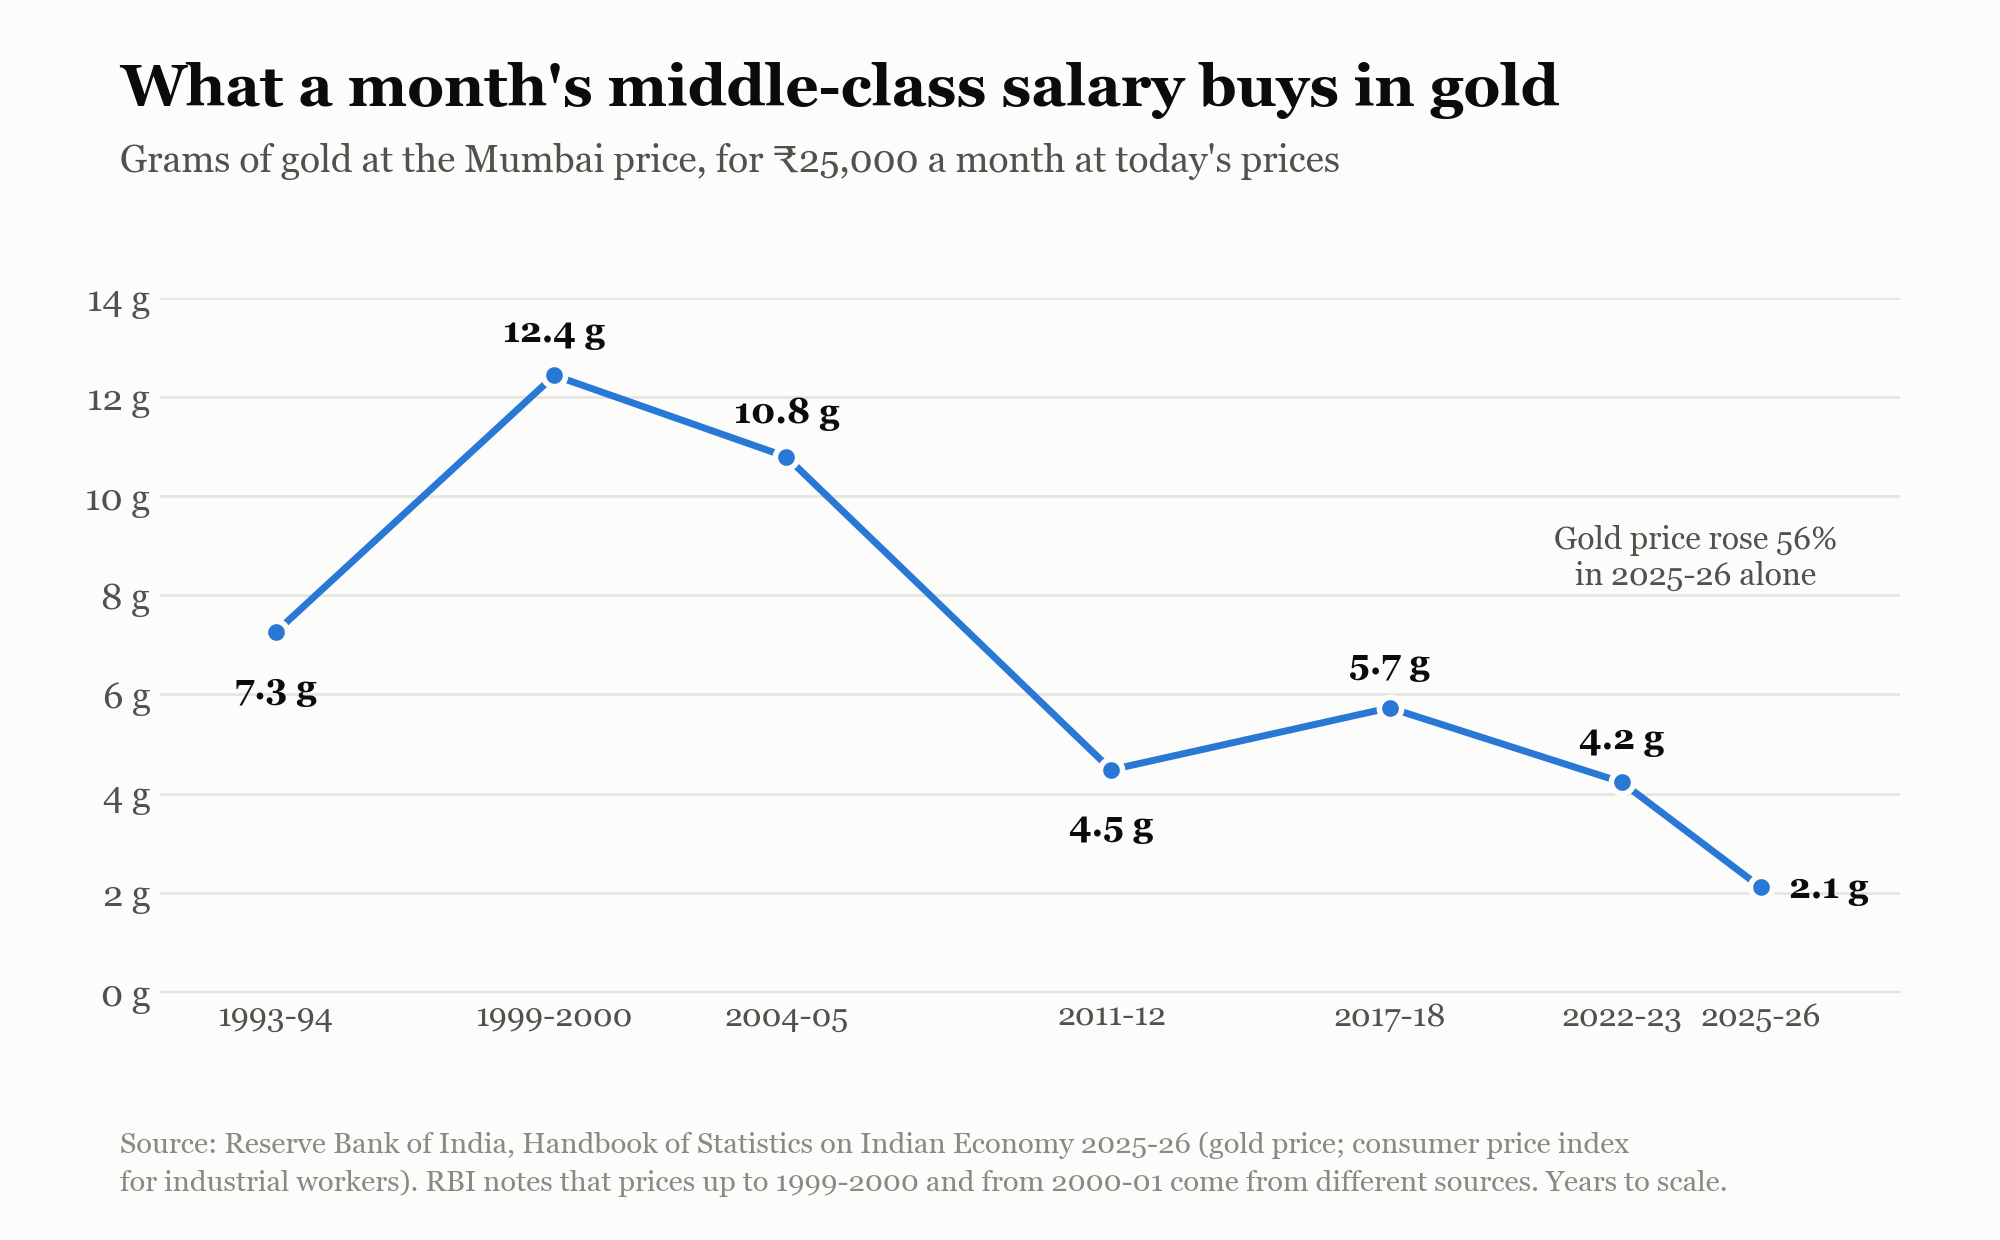
In 1993-94, a month's middle-class salary bought 7.3 grams of gold. In 1999-2000 it bought 12.4 grams, the most in the series. In 2025-26 it buys 2.1 grams, about 70% less than in 1993-94. Part of that fall came in a single year: gold rose 56% between 2024-25 and 2025-26. But even in 2022-23, before the jump, the same salary bought 4.2 grams, a third of its 1999-2000 peak.
A house costs more years of income than it used to
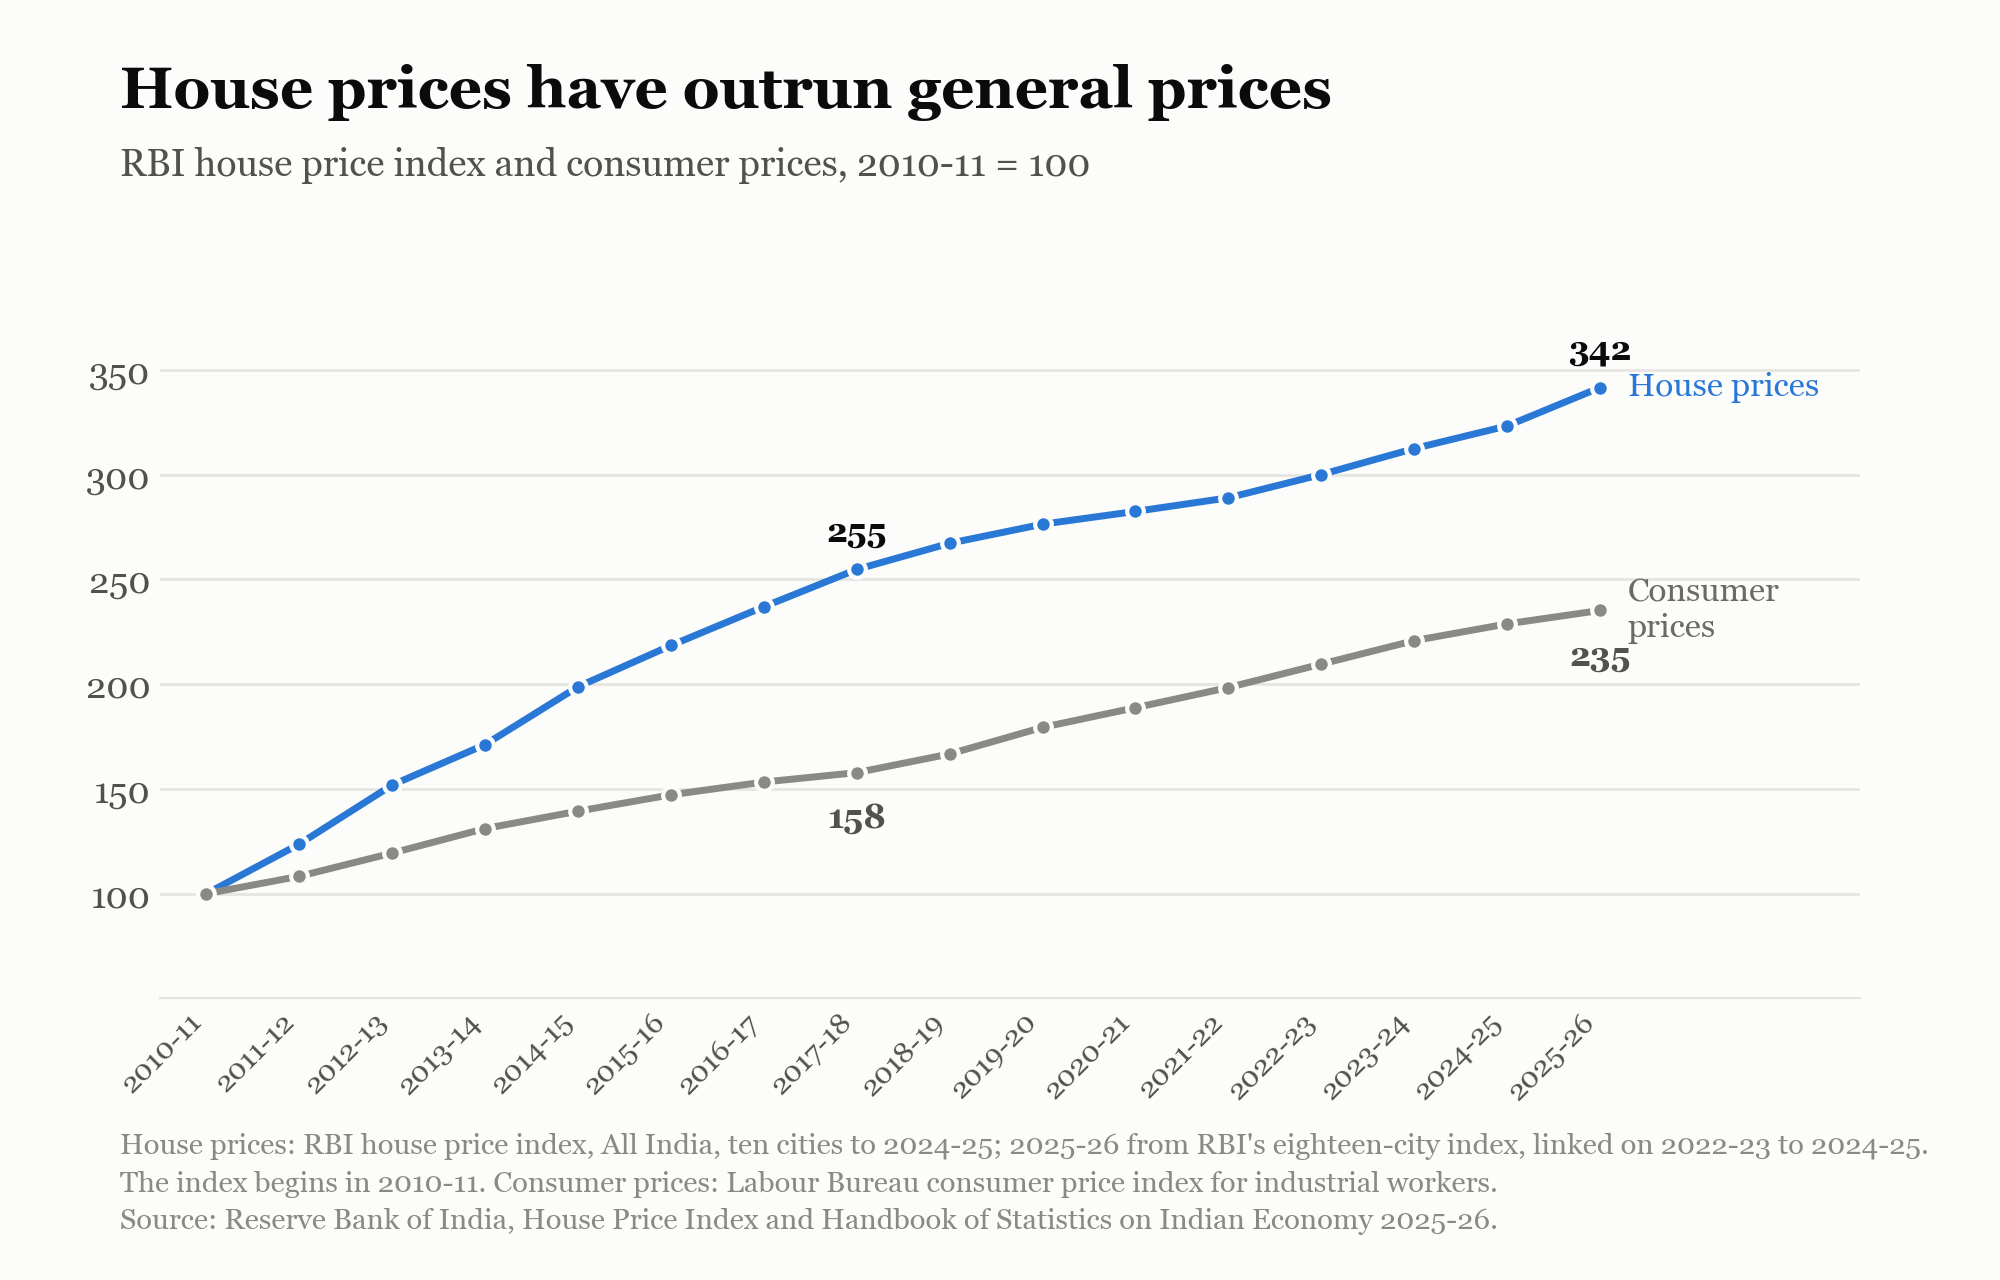
A house of one's own has moved further out of reach. Since 2010-11, when RBI's house price index begins, house prices in the cities it covers have risen much faster than general prices: by 2017-18 they were 62% ahead, and in 2025-26 they are 45% ahead.⁴ To illustrate: a home that cost five years of a middle-class salary in 2010-11 would have cost about eight years at the 2017-18 peak, and a little over seven years now. The index does not go back further, so this understates the actual increase since the 1990s.
But price is only part of the problem. The homes being built have also moved up the price range: homes priced under ₹40 lakh fell from 40% of new launches in India's seven largest cities in 2019 to 16% in 2024,⁵ while in 2012 almost all of the urban housing shortage was among low-income households.⁶ In 2011, one in ten urban houses stood vacant.⁷
An economy built for the top
Houses and gold are illustrative of a wider problem. Three in four Indian workers aged 15 to 59 who report earnings make less than ₹20,000 a month.⁸ Yet the richest 10% of adults receive 58% of the country's income and hold about 65% of its wealth.⁹ And the economy and public discourse increasingly cater to the truly affluent. By one estimate, a consuming class of about 14 crore people, a tenth of the population, accounts for about two-thirds of spending on non-essentials.¹⁰ In the seven largest cities, homes priced above ₹1.5 crore rose from 11% of new launches in 2019 to 30% in 2024.⁵ When what is built, sold and talked about is set by the top, middle-class aspirations keep running ahead of what a middle-class salary can reach.
What economic policy has to do
If an ordinary salaried job is to buy a middle-class life, economic policy and administration have two tasks.
The first is more salaried work, and better-paid work. Since 2017-18, salaried workers have grown only from 23% to 24% of all workers, and no larger share of them earns above the line; in several of the sectors that now provide those jobs, typical pay has fallen after inflation. Unless more of what the economy earns reaches people as wages, salaried pay will keep stalling, and India's middle class will remain a thin slice of its workforce.
The second concerns the assets middle-class families aspire to own. Gold prices cannot be controlled by any one national government, but the government does have a role in making housing more affordable. House prices are set largely at home: by how much urban land is released for building, what kind of housing is prioritised, how much housing is left empty, how quickly construction is approved, and how credit and liquidity flow into property. All of these are within the reach of state and central government.
Today, much of what is built and sold, from homes to consumer goods, is aimed at the most affluent. It has to be geared instead to the needs of the many: what homes and everyday life cost, how many good jobs there are, and what those jobs pay.
Also Read: The fraying promise of post-liberalisation India
¹ Nitin Kumar Bharti, Lucas Chancel, Thomas Piketty and Anmol Somanchi, "Income and Wealth Inequality in India, 1922-2023: The Rise of the Billionaire Raj", World Inequality Lab Working Paper 2024/09, Table 2. The top 10% of adults by income begins at ₹2,90,848 a year (about ₹24,200 a month), 2022-23, in 2022 prices.
² Level 1 of the central government pay matrix in 2022-23: basic pay of ₹18,000 a month, plus dearness allowance (34% of basic pay, 38% from July 2022) and house rent allowance (at least ₹1,800 a month), a total of at least ₹25,920 a month.
³ The survey's pay question changes in 2017-18: up to 2011-12 it records wages for the reference week from each day's activity; from 2017-18 it asks for the previous month's earnings from the regular job. Weekly pay is converted to monthly pay at 52/12 weeks a month, but the two questions are not identical, so comparisons across 2017-18 are approximate.
⁴ Reserve Bank of India, House Price Index: All India, ten cities, 2010-11 to 2024-25; 2025-26 from RBI's eighteen-city index, linked on the overlap years 2022-23 to 2024-25. Annual averages of quarterly values. General prices: Labour Bureau consumer price index for industrial workers (RBI Handbook of Statistics 2025-26, Table 34).
⁵ ANAROCK Research, Indian Residential Real Estate Annual Report 2024: share of new launches in the seven largest cities priced below ₹40 lakh, 40% in 2019, 30% in 2020, 26% in 2021, 20% in 2022, 19% in 2023, 16% in 2024. Homes priced above ₹1.5 crore: 11% of launches in 2019, 30% in 2024. The ₹40 lakh line is not adjusted for rising prices.
⁶ Technical Group on Urban Housing Shortage (2012-17), Ministry of Housing and Urban Poverty Alleviation (release of 2012): a shortage of 1.88 crore urban homes in 2012, 56.2% among economically weaker households, 39.4% among low-income households and 4.4% among the rest (report table).
⁷ Census of India 2011, Table H-1: 1.11 crore of 11.01 crore urban census houses were vacant.
⁸ Calculated from the 2025 employment survey, Ministry of Statistics and Programme Implementation: 31.95 crore of 42.02 crore workers aged 15-59 with recorded earnings made less than ₹20,000 a month. Workers are counted by their usual main or second job, with an occupation recorded, scaled to the survey's total of 55.2 crore workers. Pay is the previous month's earnings for employees, the last 30 days' gross earnings for the self-employed, and for casual workers an estimate from their daily wage.
⁹ Same source as note 1, Table 2 and Table 3: in 2022-23 the top 10% of adults received 57.7% of national income and held 65% of wealth.
¹⁰ Blume Ventures, Indus Valley Annual Report 2025, drawing on Blume, Bernstein and Goldman Sachs estimates: the consuming class it calls "India 1", about 14 crore people, accounts for about two-thirds of discretionary spending. A modelled estimate, not a survey measure.
Follow our blog to stay updated on our programs and other content ↗