Did Liberalisation Open Up Work for India's Women?
Between 2004-05 and 2017-18 the share of Indian women in work fell by almost half. Most of the return since then is women over 30, and most of it is farm work.
India opened its economy in 1991. One of the promises was that growth would bring better work. In this column, we examine what happened to women's work in the decades after liberalisation.
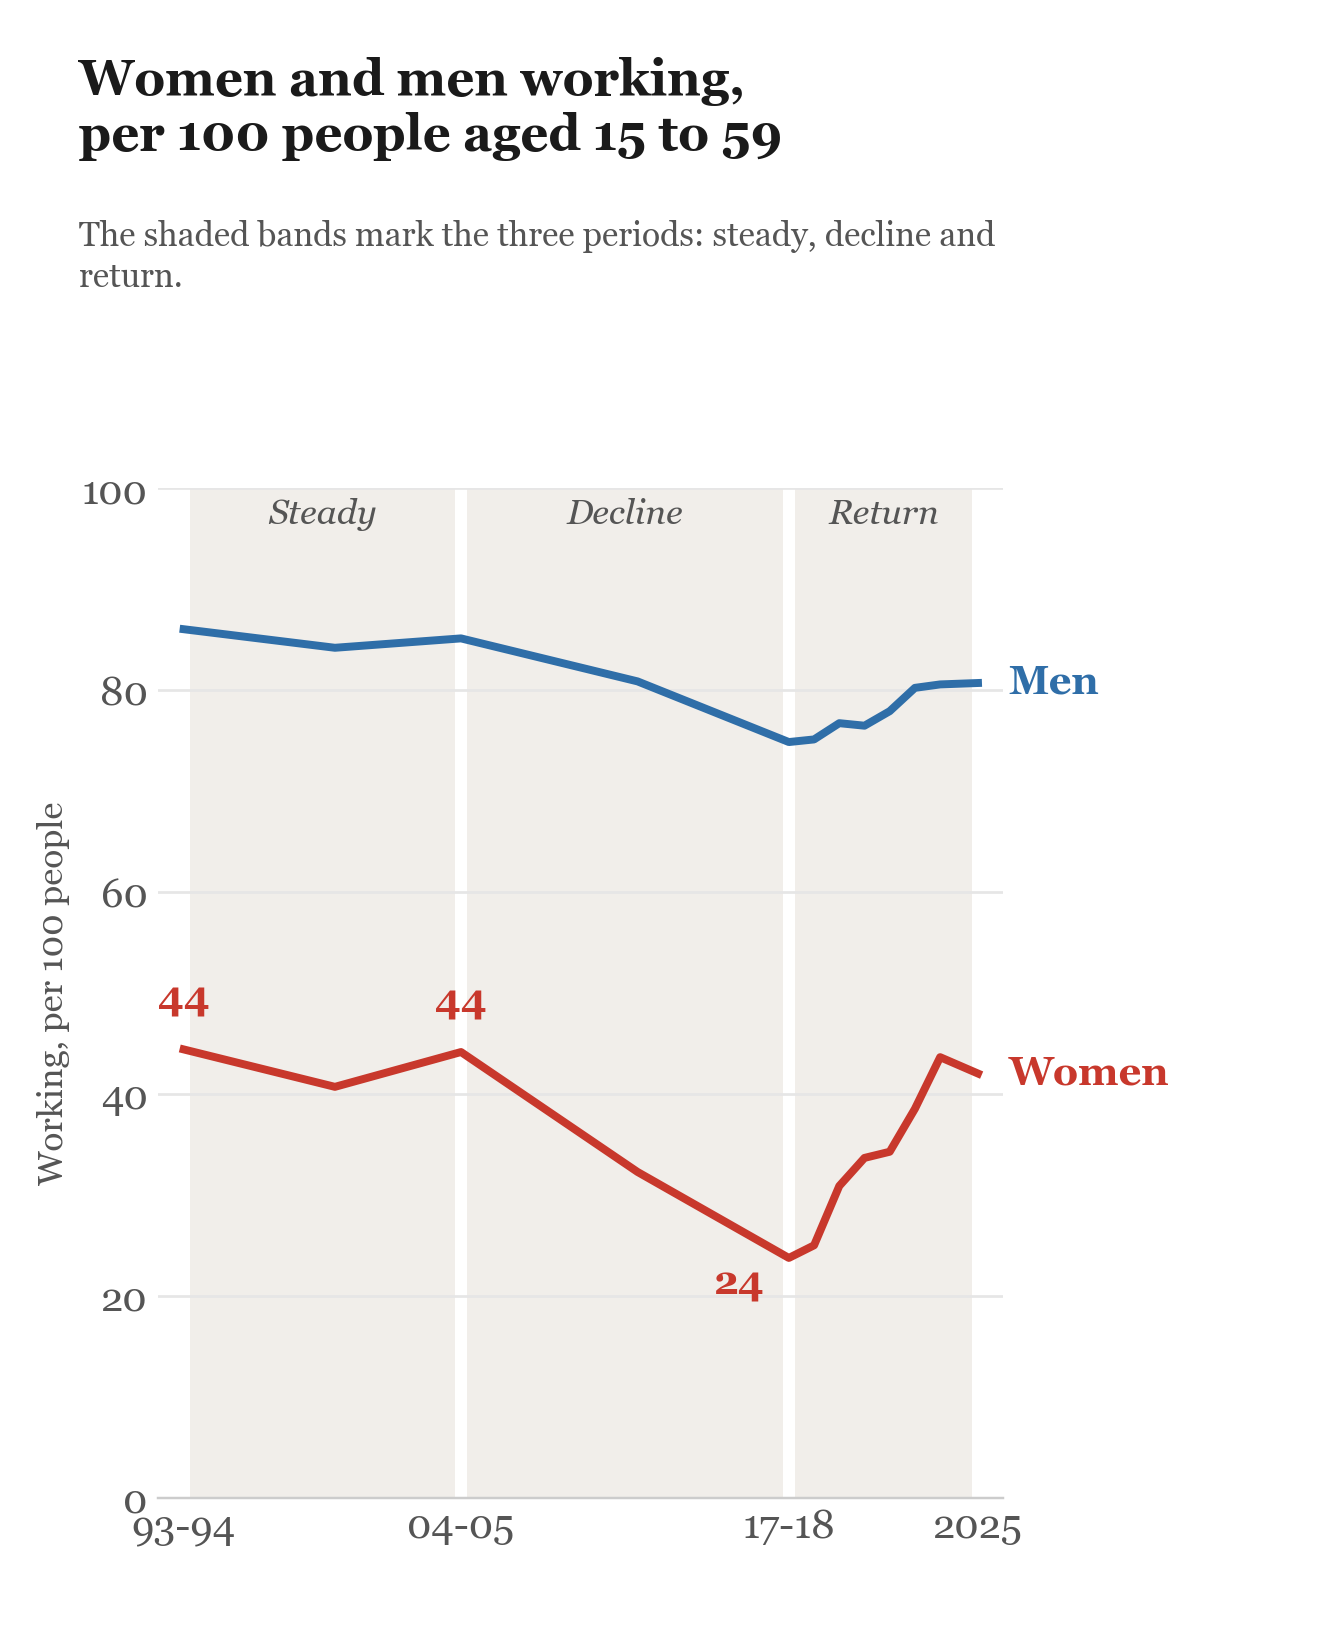
It is helpful to think of women's work after liberalisation in three periods: 1991* to 2004, 2004 to 2017, and 2017 to now.
Women's work held steady, fell by almost half, then climbed back
The share of women working was 44% in 1993-94 and again in 2004-05. It then fell steadily, to less than 25% by 2017-18. Since then women have returned to work in large numbers, mostly to farms and to work of their own, and many of them without pay. In 2025, 42% of women aged 15 to 59 were working.¹
Men's share fell too, from 86% in 1993-94 to 75% in 2017-18, and was 81% in 2025. Their fall was about half the size of women's.
 Source: Ministry of Statistics and Programme Implementation, employment surveys 1993-94 to 2025; our calculations.
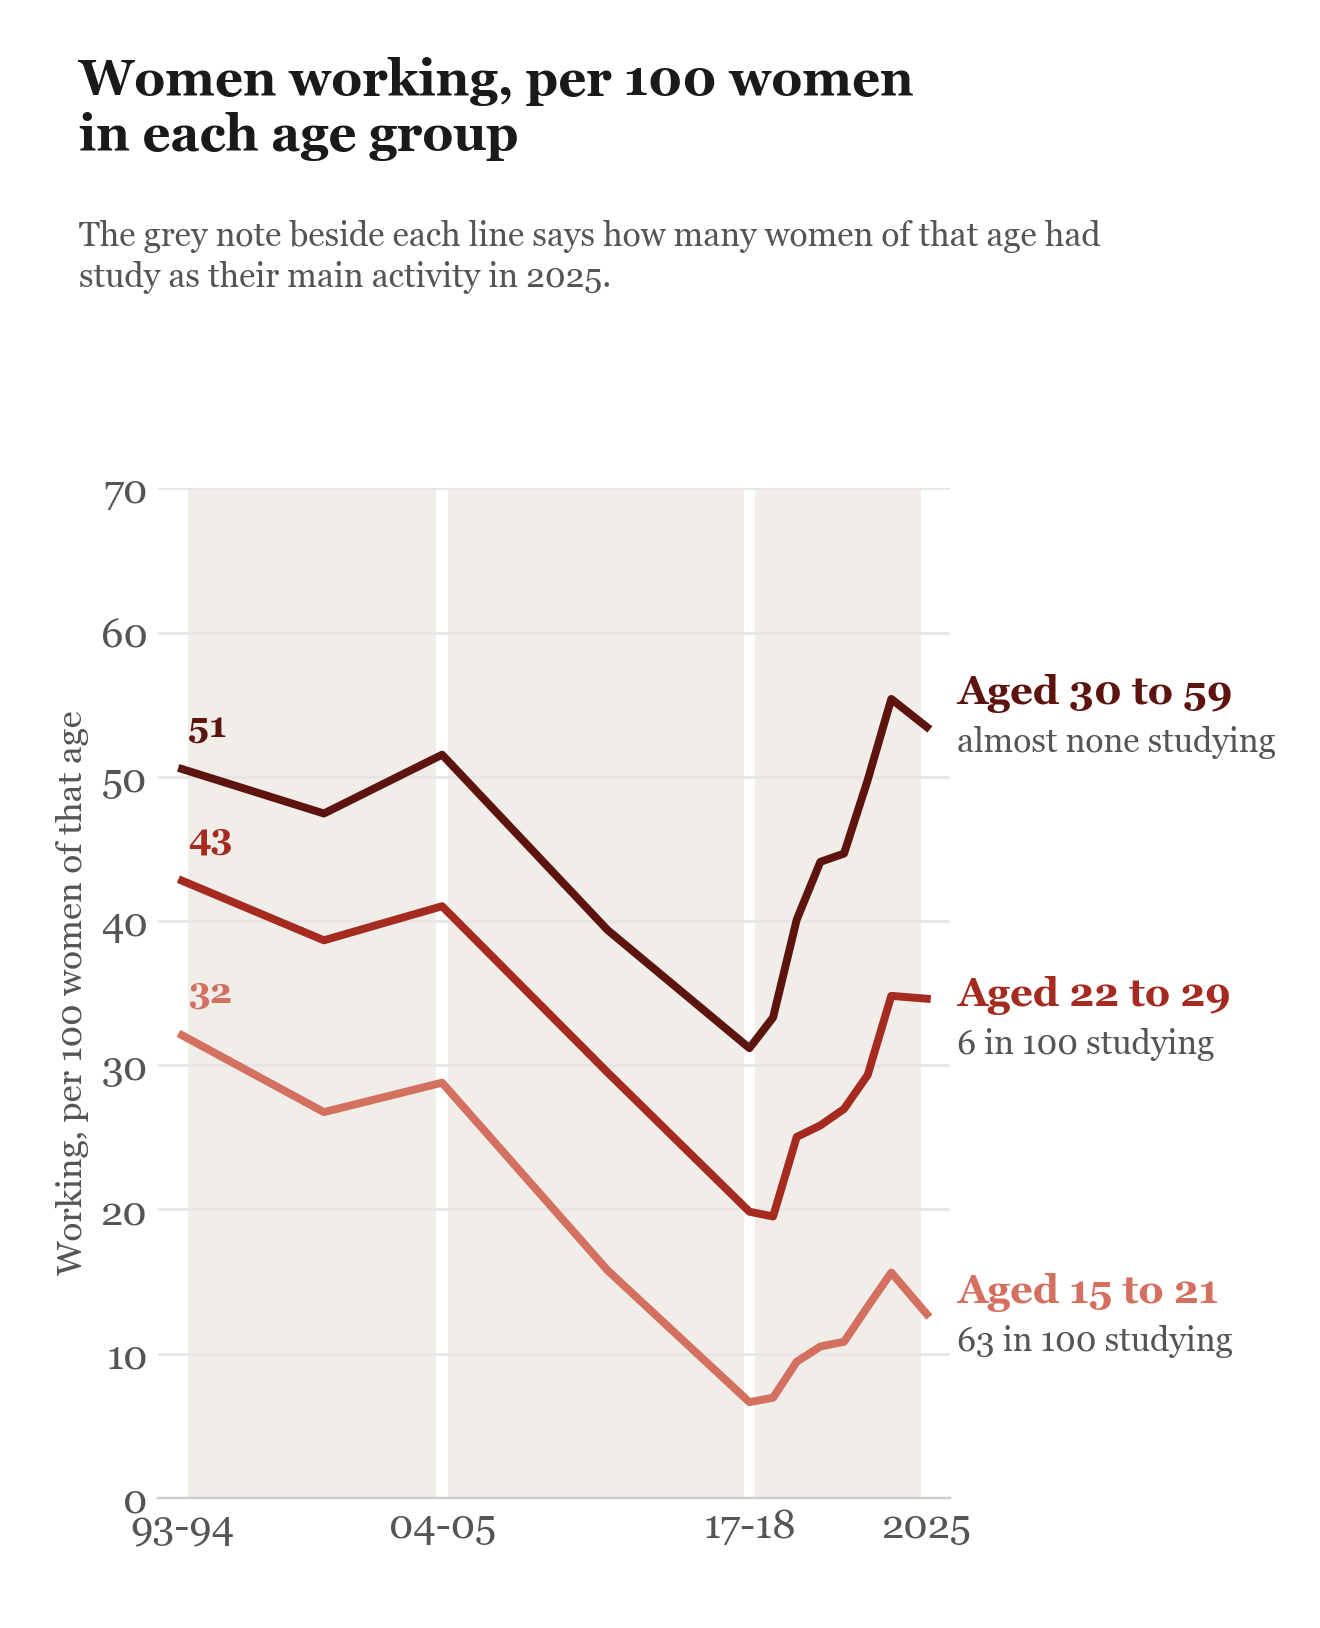
The decline in work was not mainly due to rising education. Women of every age left work, including those long past school
Between 2004-05 and 2017-18, the share of women aged 30 to 59 who worked fell from 52% to 31%, and almost none of them were studying. Among women aged 22 to 29, it fell from 41% to 20%.
Rising education explains part of the fall only for the youngest. Among women aged 15 to 21, those whose main activity was study rose from 31% to 57%, and those working fell from 29% to 7%.²
The return since 2017-18 has been led by older women. In 2025, 53% of women aged 30 to 59 were working, more than the 51% of 1993-94. Women aged 22 to 29 came back only part of the way, to 35%, against 43% in 1993-94.
 Source: Ministry of Statistics and Programme Implementation, employment surveys 1993-94 to 2025; our calculations.
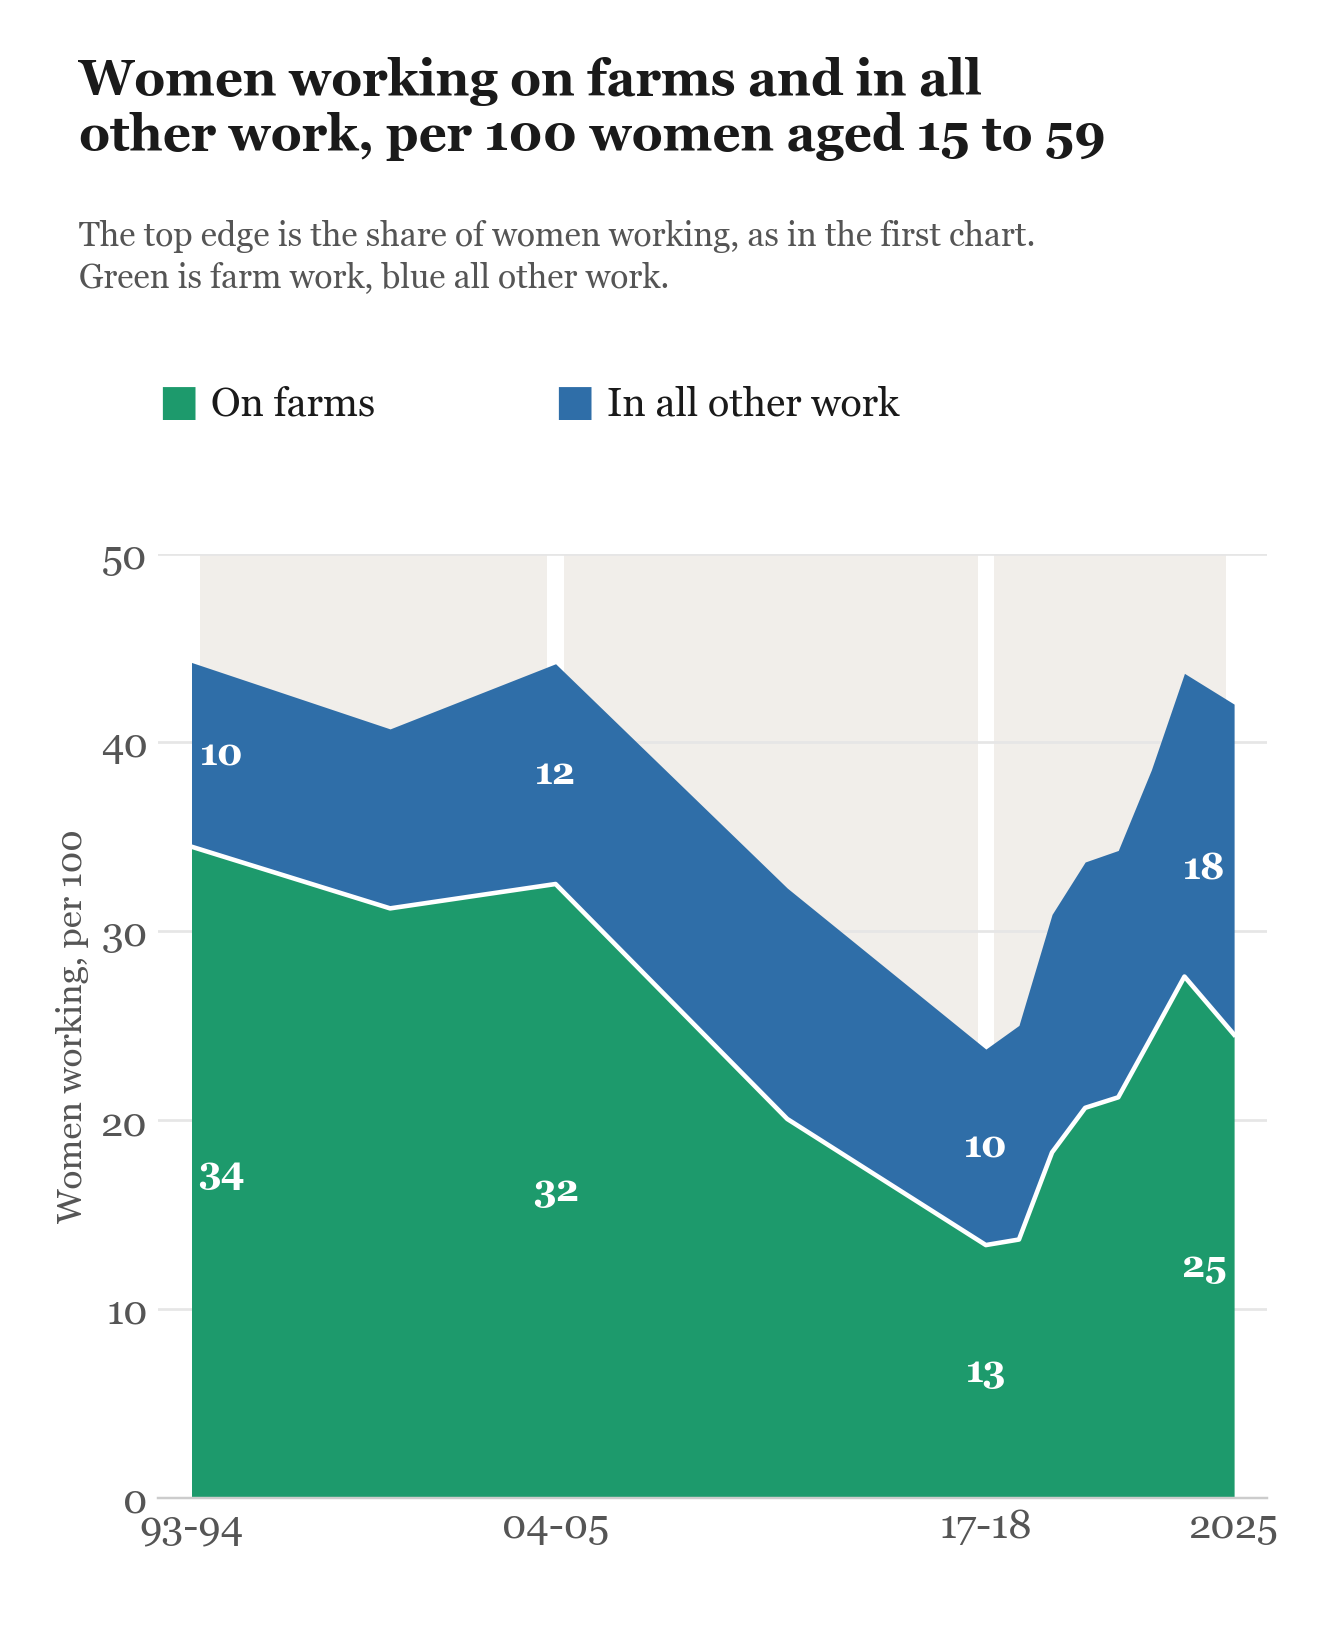
So what does explain it? For every survey year, we counted how many women in every 100 worked on farms and in other work.³ ⁴
Almost the whole fall, and most of the return, was farm work
From 1993-94 to 2004-05, farm work shrank a little and other work made up for it. Women working on farms fell by 2 in every 100, and work off the farm grew by about the same.
From 2004-05 to 2017-18, farm work fell sharply, and work off the farm did not grow to replace it. Women working on farms fell from 32 to 13 in every 100, almost the entire fall in women's work.⁵ Work off the farm shrank slightly.
From 2017-18 to 2025, women came back, mostly to farms. Women working on farms rose from 13 to 25 in every 100, and work off the farm from 10 to 18. The return began before the pandemic.⁶
 Source: Ministry of Statistics and Programme Implementation, employment surveys 1993-94 to 2025; our calculations.
Work off the farm barely grew until 2017-18, then rose by 7 in every 100 women
Until 2017-18, about 10 in every 100 women worked off the farm, as many as in 1993-94. Over the same years, men working off the farm rose from 37 to 47 in every 100.
Since 2017-18, women's work off the farm has risen to 18 in every 100. About half of the increase is women working for themselves or in a family business, mostly tailoring, embroidery, bidi rolling and small shops. Most of the rest is salaried jobs.
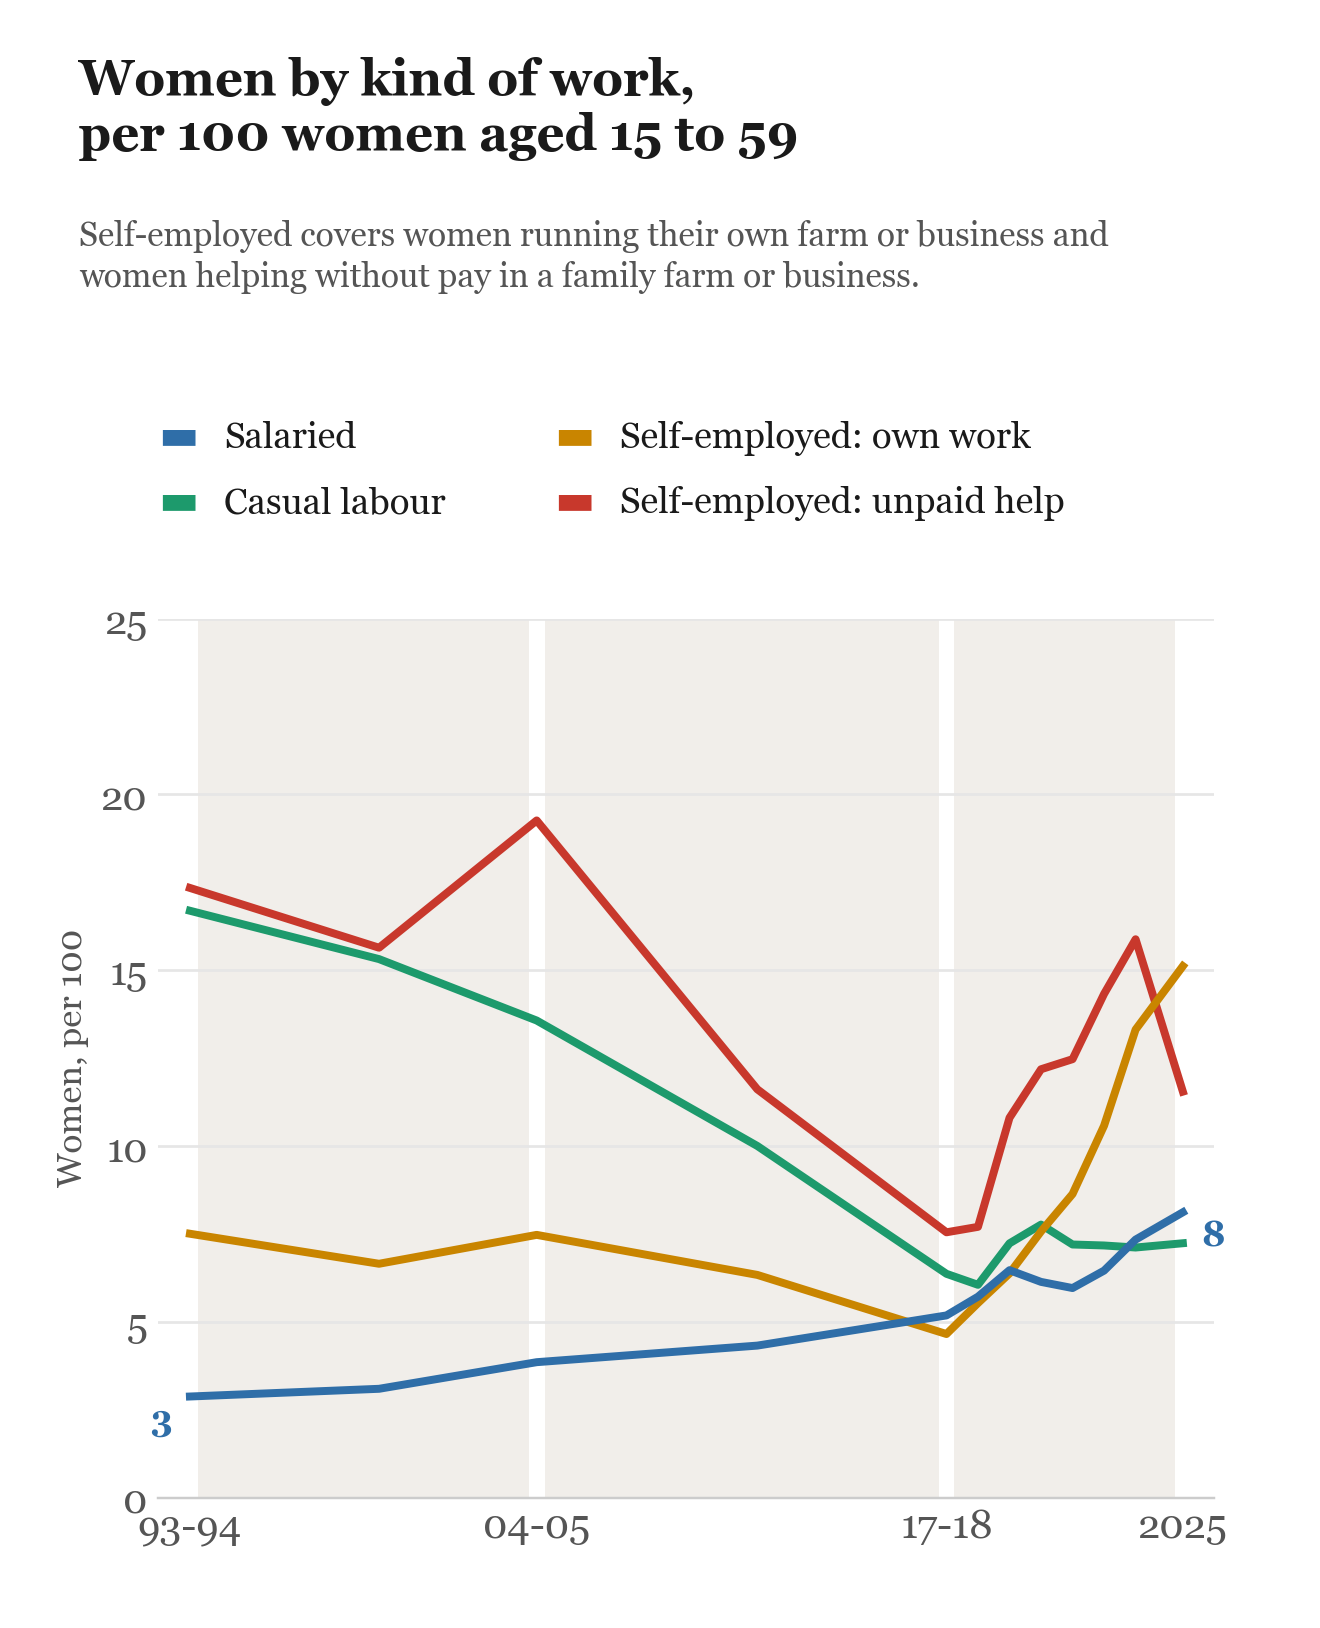
Salaried work grew in every period, but self-employed work, much of it unpaid, dominates
Almost two in three working women are self-employed, and more than four in ten of them work without pay.⁷ Salaried work has grown in each of the three periods, even when women's work as a whole fell, but only from 3 to 8 in every 100 women. Casual labour has fallen by more than half.
 Source: Ministry of Statistics and Programme Implementation, employment surveys 1993-94 to 2025; our calculations.
More than three decades after liberalisation, about the same share of women work, and most still work for themselves or their families
Between 1993-94 and 2025, the share of women working barely changed, from 44 to 42 in every 100. Self-employed women, working for themselves or helping without pay in a family farm or business, rose slightly, from 25 to 27 in every 100. Salaried work rose in every period, from 3 to 8 in every 100 women, but it is still small next to self-employment. In the decades after liberalisation, work off the farm grew for men; for women it barely grew until 2017-18, and about half of the rise since then is self-employment.
What comes next
Part 2 looks at the salaried work women found, whether their pay has kept up, and what can be done to bring more women into paid work.
Notes
* Our data begin in 1993-94.
¹ All figures are our calculations from the unit-level records of the Ministry of Statistics and Programme Implementation's employment surveys for 1993-94, 1999-2000, 2004-05 and 2011-12 and its annual labour force surveys from 2017-18 to 2025. The 2025 survey uses a new sampling design and a calendar year, and the ministry cautions that it may not be strictly comparable with earlier years.
² Between 2004-05 and 2017-18, the share of women aged 15 to 59 who were students rose by 5.5 points, while the share working fell by 20.4 points. Even if every one of those additional students would otherwise have been working, more education would account for little more than a quarter of the fall.
³ The share of women working counts women aged 15 to 59 who worked for most of the year, together with those whose main activity was something else, such as housework or study, but who also worked as a side activity. Work includes unpaid work in a family farm or enterprise, as official statistics count it.
⁴ Each count is the number of women working in that kind of work for every 100 women aged 15 to 59, so the counts add up to the share of women working, except in 1993-94, when the industry of 0.2 in every 100 women was not recorded.
⁵ Farm work means agriculture, including livestock, forestry and fishing. Between 2004-05 and 2017-18, women working on farms fell by 19.1 in every 100 women and all women's work by 20.4.
⁶ Comparing the same months, July to March, the share of women working rose from 24% in 2017-18 to 31% in 2019-20. The survey year 2019-20 runs from July 2019 to June 2020, so its last three months fall in the national lockdown; these figures use only the July to March months of each year.
⁷ Self-employed women are those running their own farm or business, the few who employ others, and unpaid helpers in a family farm or business, as official statistics define it.
Follow our blog to stay updated on our programs and other content ↗