IT Sector Helped Build the Indian Middle Class. For Its Workers, It Is Starting to Sputter.
Software exports have doubled since 2017-18. Since 2023-24, jobs, pay and labour's share of the value the sector adds have fallen.
Topics: Jobs · Middle class · Economy · IT sector
In previous articles, we showed that IT has become an important route into India's middle class. The sector employs only about 1 in 90 Indian workers, yet it accounts for nearly 12% of those who meet our middle-class benchmark for employment and income. About 82% of IT workers are graduates in regular salaried jobs, which makes the sector one of the few sources of stable, well-paid work open to young graduates.
This article examines what has happened to the sector's hiring, and to young graduates in particular, since generative AI arrived and US visa policy tightened.
The short answer is that the sector's growth has stopped reaching its workers.
Software exports kept rising through 2025-26. However, employment, the sector's share of graduate jobs, real earnings and labour's share of the value the sector adds all peaked in 2022-23 or 2023-24, and have since fallen. This divergence is what the sector's leaders have said they want: HCL's chief executive told a NASSCOM summit in 2025 that firms should 'generate twice the revenue with half the workforce'. The numbers suggest firms are already acting on it.
Software exports roughly doubled between 2017-18 and 2025-26
RBI data show software-services exports rising from about $108 billion in 2017-18 to around $221 billion in 2025-26, roughly doubling over eight years, including a 16% rise between 2023-24 and 2025-26. NASSCOM's broader revenue estimates¹ follow a similar path, up about 17% over the same two years on its projection for 2025-26, although the two series do not cover exactly the same activities.
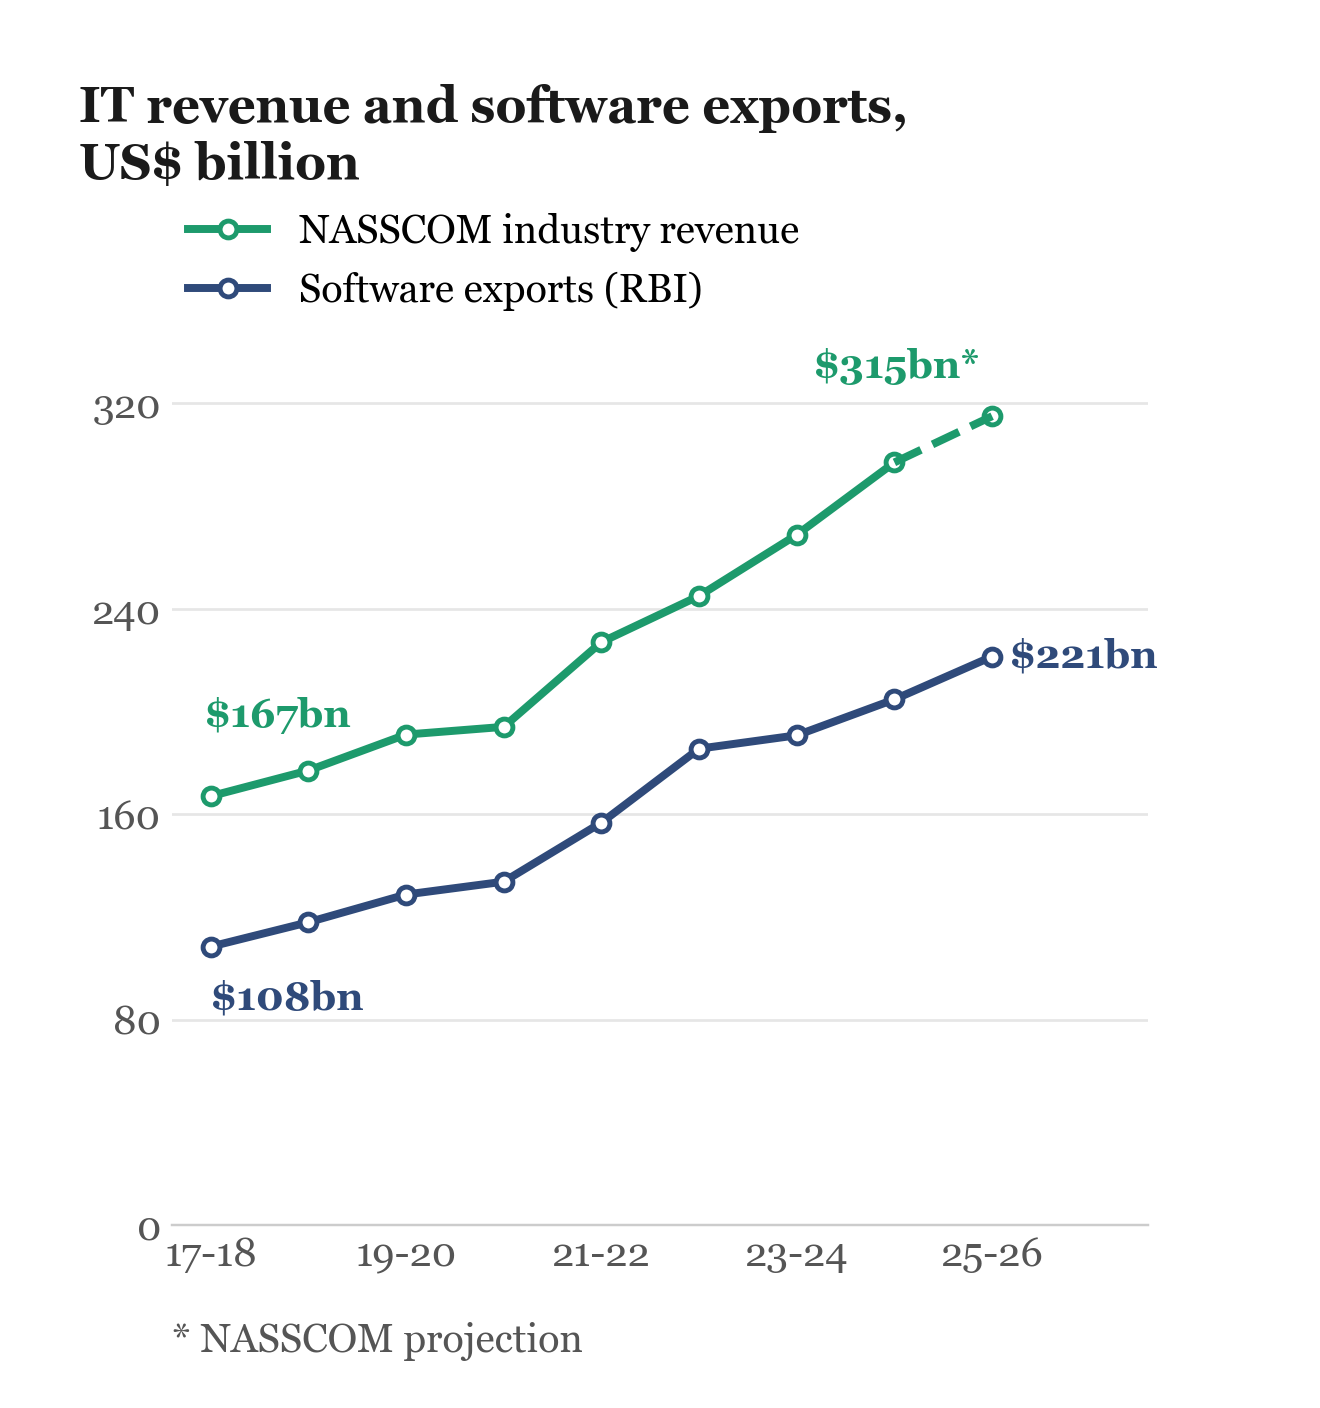 Source: NASSCOM Strategic Review, total industry revenue, domestic and export (2023-24 and 2024-25 restated; 2025-26 a projection). RBI survey of software services exports, excluding sales through overseas affiliates.
However, IT's share of graduate jobs peaked in 2022-23, and then fell
IT's share of salaried graduates rose from 6.9% in 2017-18 to 13.7% in 2022-23, then fell to 11.2% in 2025. Among all graduates in the labour force, whether working or looking for work, IT's share went from 3.9% to 7.4% and then down to 6.0%. The sharpest fall was among salaried graduates aged 21 to 25, for whom IT's share dropped from 20.0% in 2022-23 to 15.8% in 2025.
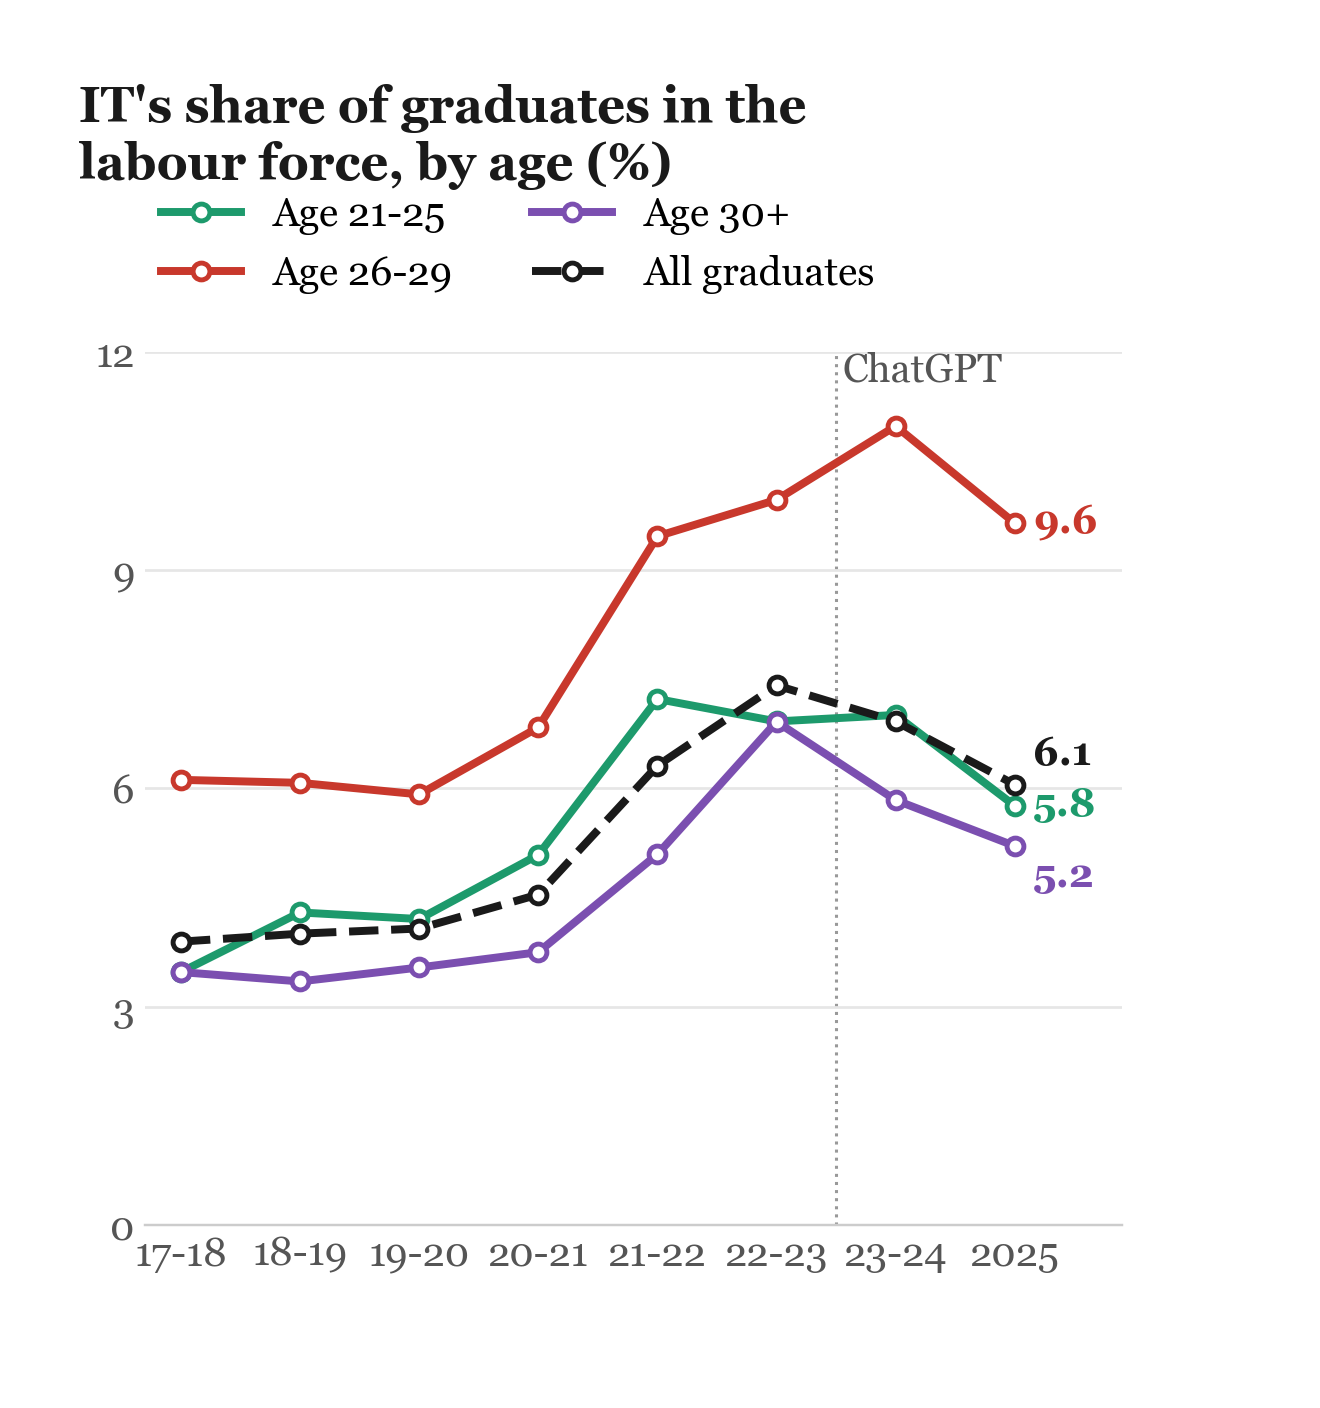 Source: PLFS. IT is NIC divisions 62-63. Each line is IT's share of graduates in the labour force (working or looking for work) in that age band. 2025 is from the revamped survey.
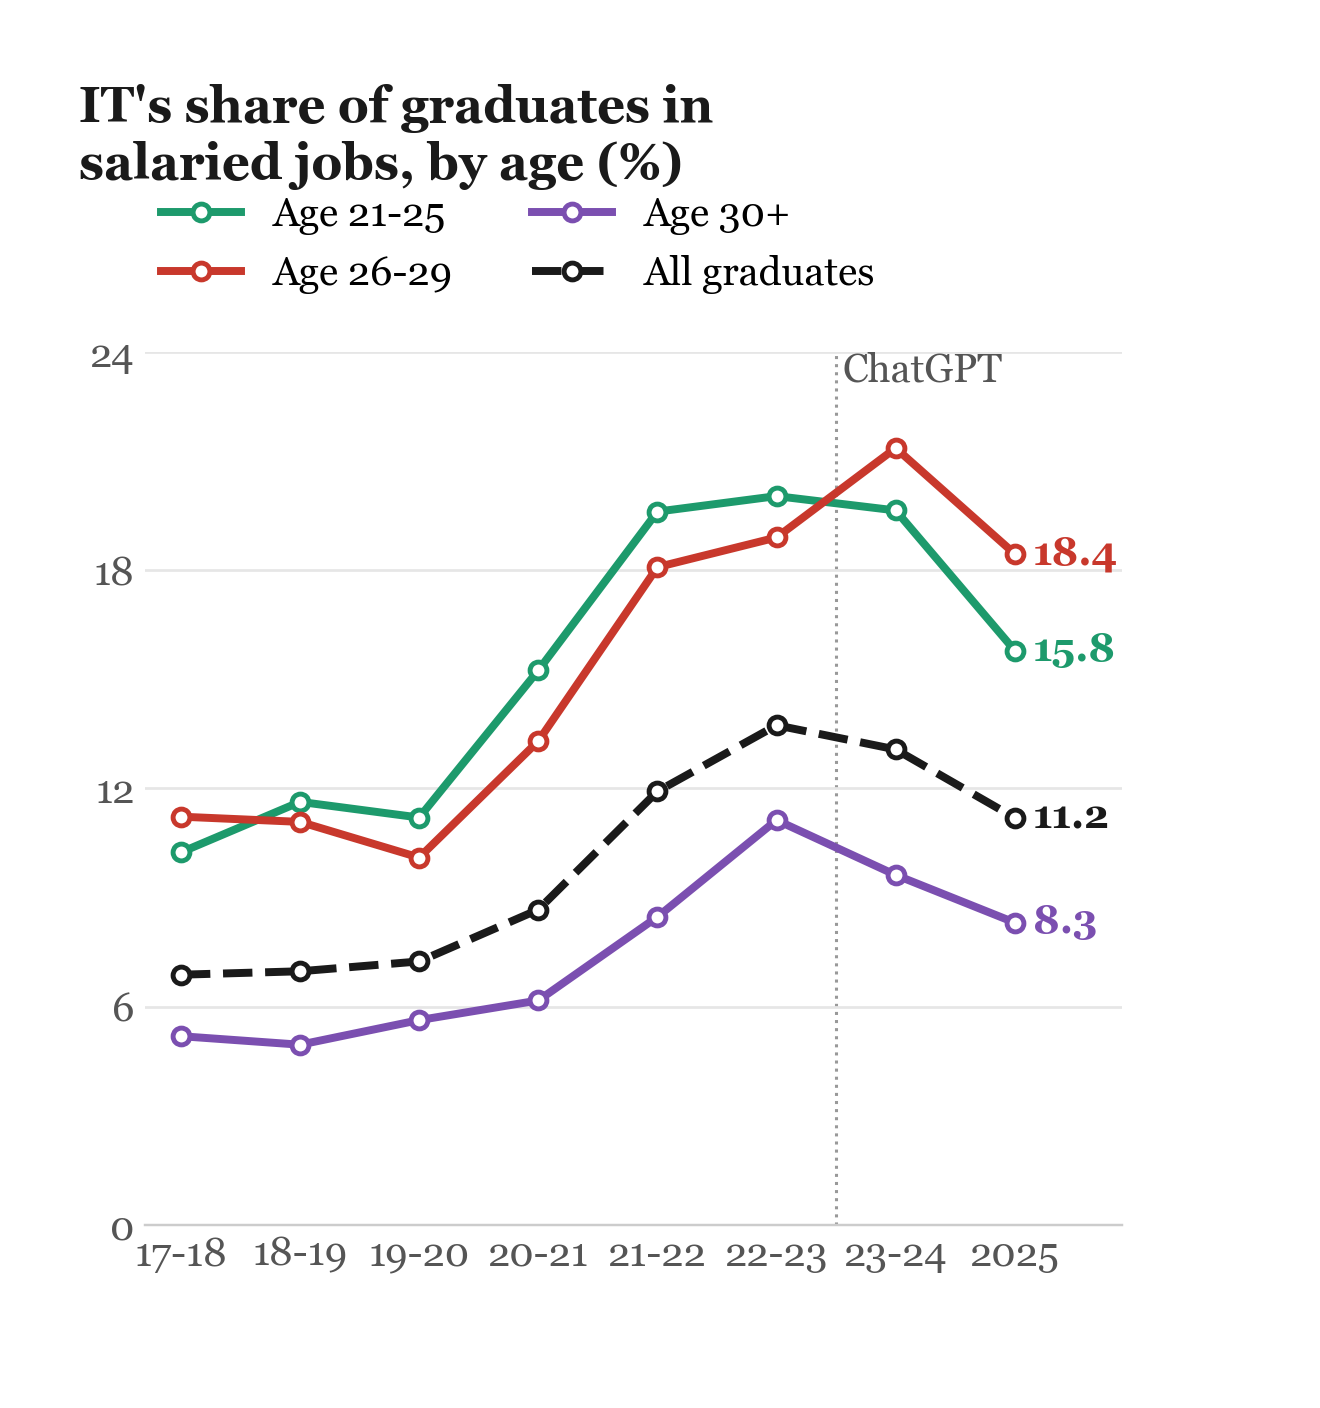 Source: PLFS. IT is NIC divisions 62-63. Each line is IT's share of graduates in regular salaried jobs in that age band. 2025 is from the revamped survey.
Headcount stopped growing after 2023-24
Overall IT employment grew from 28.8 lakh in 2017-18 to 69.3 lakh in 2023-24, before slipping to 68.2 lakh in 2025. Within that workforce, software developers and analysts fell from 42.5 lakh to 36.7 lakh between 2023-24 and 2025, a drop of about 14%. Over the same period, keyboard operators' share of IT employment rose from 6.1% to 10.3%, and ICT operations and support technicians' share from 2.7% to 5.9%.
The number of graduates in salaried IT jobs also fell from its recent highs, though the change varied by age. Those aged 30 and over were down 6.5% from their 2022-23 high, and those aged 21 to 25 down about 10% from their 2023-24 high. Those aged 26 to 29 were almost unchanged, down less than 1%.
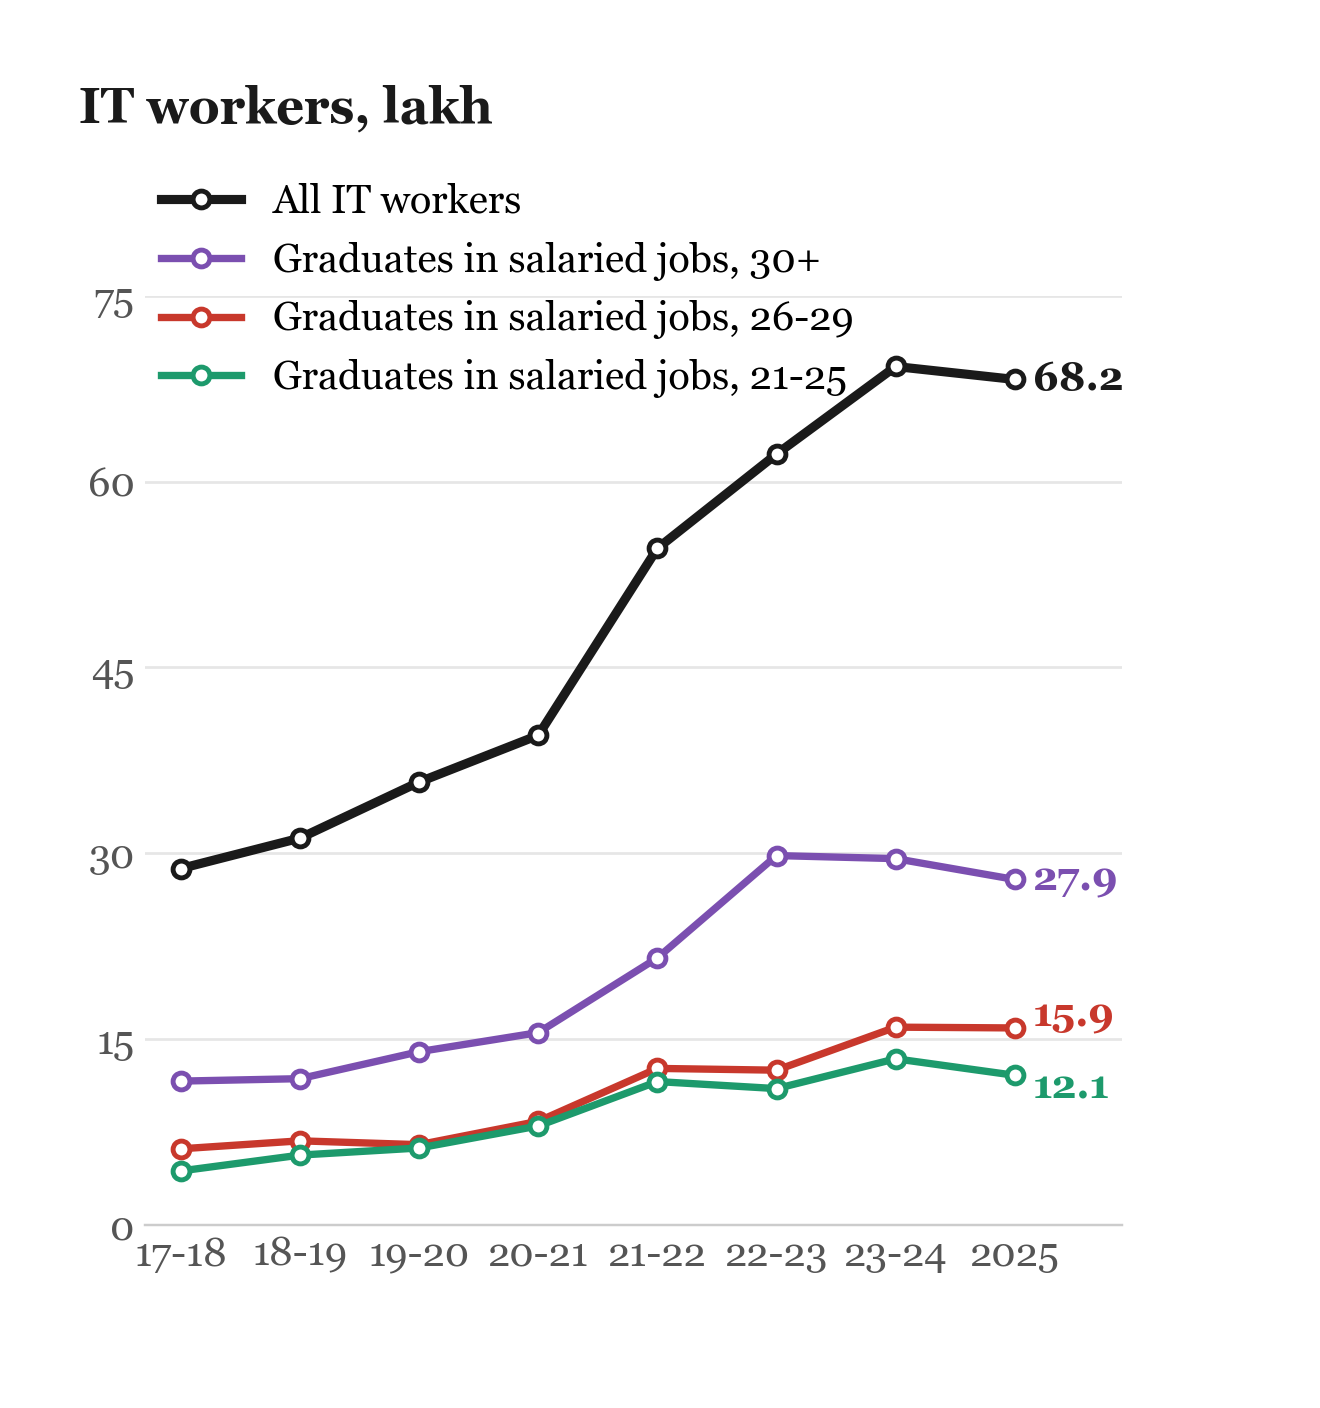 Source: PLFS. All IT workers covers every education level and type of work; the age lines are graduates in regular salaried jobs. 2025 is from the revamped survey.
Similarly, labour's share of IT's value added peaked in 2023-24, then fell
Labour earnings² were only about 14% of the IT sector's value added in 2017-18. By 2023-24 they had grown to 4.0 times their initial level, while value added grew to 2.5 times, so labour's share reached nearly a quarter on the old national-accounts series. On the new series, from 2022-23 to 2024-25, value added grew by about 26% while earnings grew by about 20%, and labour's share fell.³
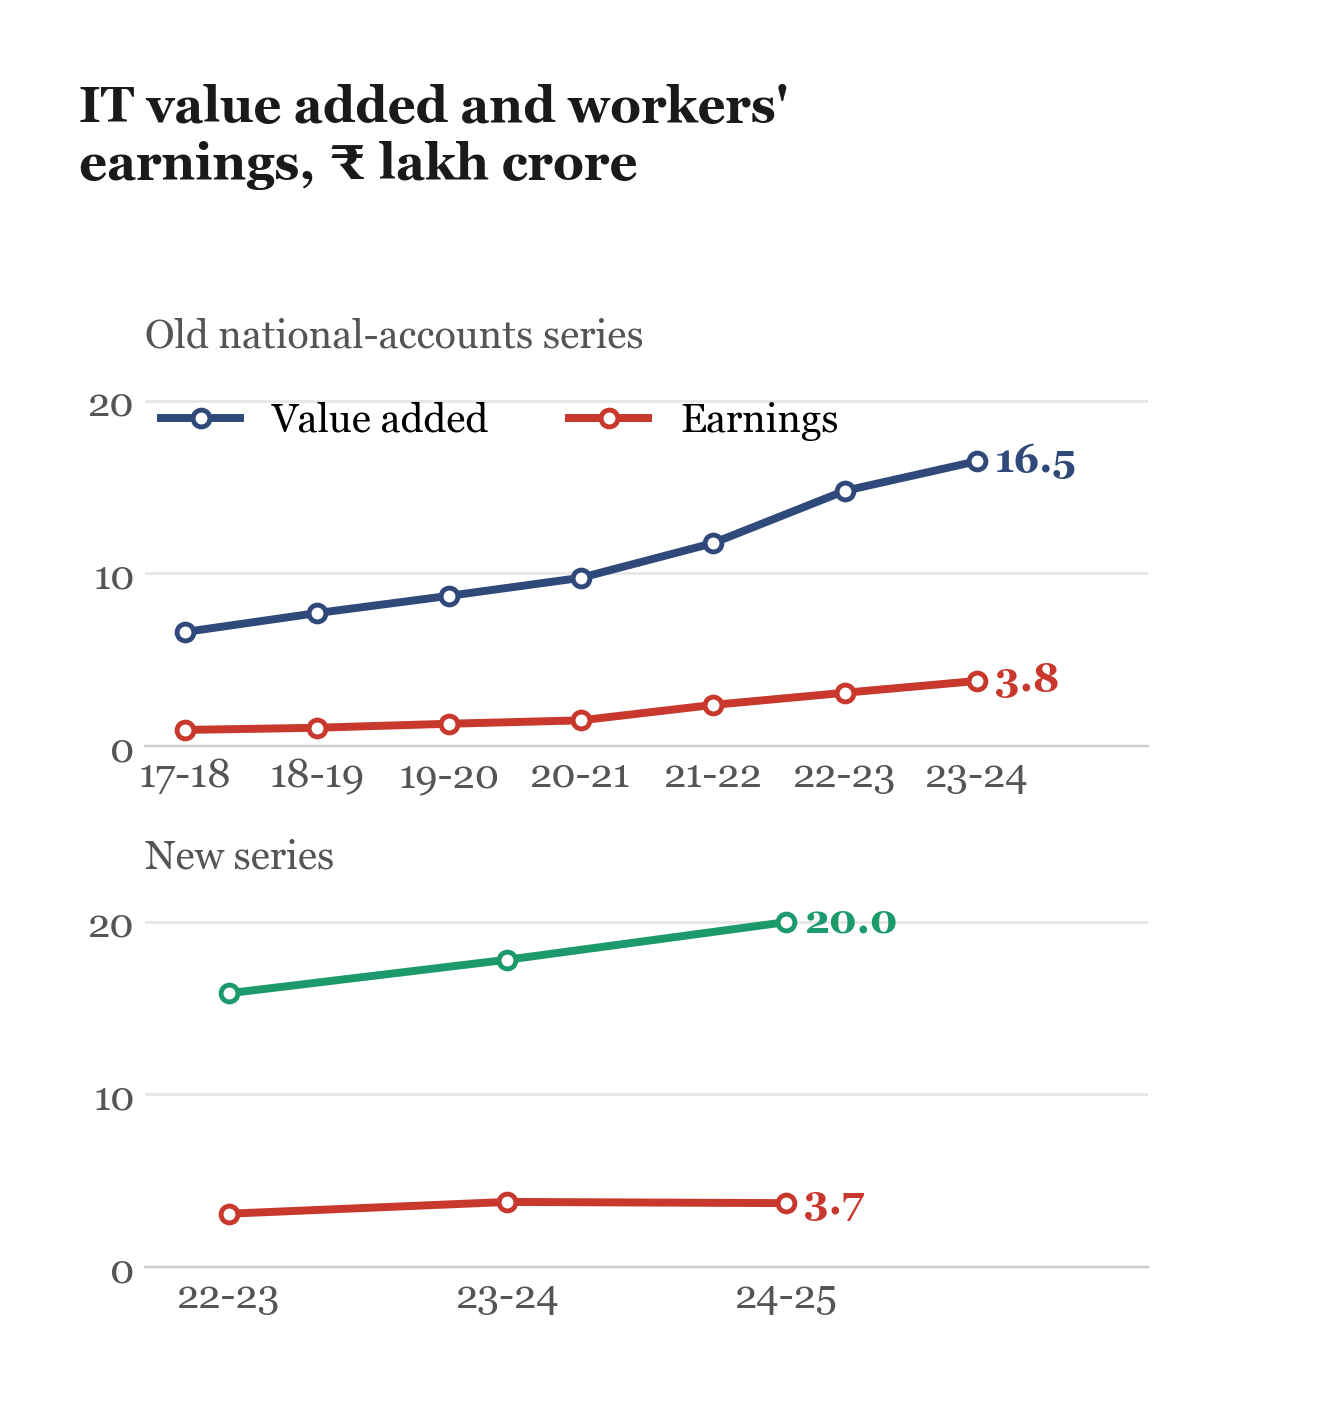 Source: MoSPI national accounts, current prices; PLFS earnings, scaled to the population. The two national-accounts series have different base years and are not joined; 2024-25 value added is paired with 2025 earnings.
IT workers' earnings peaked in 2023-24 and then fell
In 2025 prices, the median monthly earnings of IT workers rose from about ₹35,700 in 2017-18 to ₹40,000 in 2025. Earnings were higher in 2023-24, so the latest figure is a step down. In 2025, workers aged 30 and over had the highest median earnings, at ₹45,000 a month, and those aged 21 to 25 the lowest, at ₹28,000.
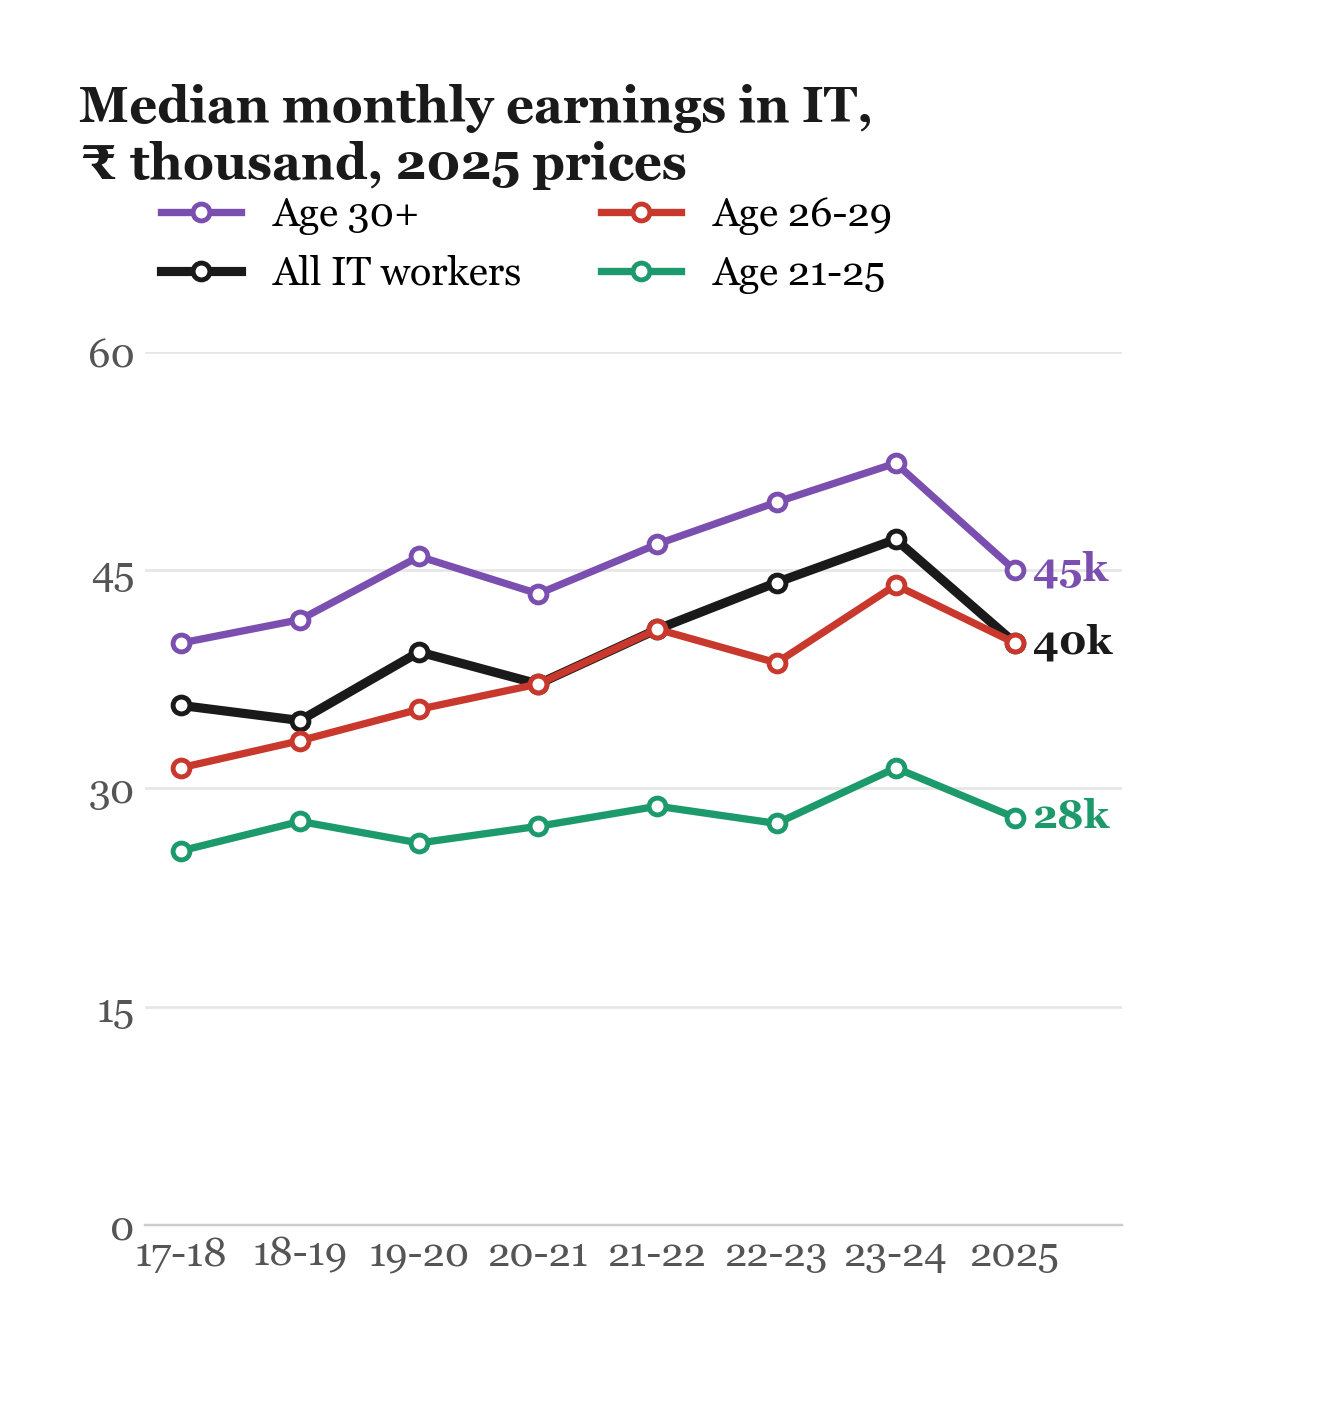 Source: PLFS. All IT workers with recorded earnings, in 2025 prices (CPI-Combined). 2025 is from the revamped survey.
What the timing suggests
Revenues and software exports kept growing through 2025-26, but that growth did not translate into continued gains for workers.
IT employment, graduate salaried employment and real median earnings are falling from their 2022-23 or 2023-24 highs, and labour earnings have grown more slowly than value added on the latest series. The mix of jobs has shifted too: developer and analyst jobs are shrinking, while more routine roles are growing.
ChatGPT was released in November 2022. Since then, IT's share of salaried jobs for graduates aged 21 to 25 has fallen from 20% to 16%, the number of software developers and analysts has fallen from 42.5 lakh to 36.7 lakh, and workers' earnings have grown more slowly than the sector's value added.
Three overlapping explanations fit. The first is a correction after the hiring surge of the pandemic years. The second is AI-washing: firms citing AI to justify layoffs and hiring freezes they would have made anyway. The third is real displacement, with AI doing work that employees once did. It is too soon to tell them apart. However, for the graduates looking for work, the result is the same either way: fewer jobs and slower pay growth.
What this means for India's development model
India's growth since liberalisation has leaned on services more than on factories, and IT has been the flagship of that path. Its share of middle-class jobs is roughly ten times its share of the workforce. For a young graduate, a job in IT has been one of the few reliable routes to a stable, salaried, middle-class income.
The route abroad runs through the same sector. In the US fiscal year 2024, 71% of approved H-1B petitions, the main American visa for skilled workers, went to people born in India, and 64% were for computer-related jobs. Since March 2026 the annual H-1B lottery has been weighted towards pay. An applicant offered the highest wage level gets four entries and one offered the entry level gets one. A $100,000 fee on new petitions for workers outside the United States, announced in September 2025, is held up in court but is indicative of where political energies lie. Both measures bear hardest on the people this data shows losing ground at home: graduates at the start of their careers.
IT has paid the highest median earnings of any sector in every year since 2017-18: ₹40,000 a month in 2025, against ₹32,000 in public administration, the next highest. If its entry-level jobs thin, there is no obvious second rung of the same height for young graduates to step onto.
The series so far shows that the development model India has relied on since liberalisation is now coming under stress. The Indian middle class is a small sliver but supports the broader economy through cascading jobs and consumption. It is thus important for our national and state leadership to think through India's development challenges afresh, especially in light of its burgeoning youth population, aspirational and looking for jobs.
Read next: AI, Work and the Democratic Bargain, an essay on how AI threatens India's development model and how India can govern AI's effect on work.
Notes
¹ NASSCOM restated its 2023-24 estimate after updating its coverage of global capability centres, and later revised its 2024-25 estimate upward. Its year-on-year growth across these boundaries (2022-23 to 2023-24, and 2023-24 to 2024-25) partly reflects this accounting update rather than organic growth.
² Labour earnings here are what IT workers report earning in the survey, scaled to the whole population, not the national accounts' compensation of employees. Our earnings estimates likely understate the true labour share. PLFS's own field instructions exclude employer provident fund and pension contributions from earnings, even though these are a normal part of an IT salary (PLFS Instructions to Field Staff, Vol. I, para 1.5.25). Separately, a 2024 World Inequality Lab study on Indian income data notes that survey-based income figures are expected to understate income growth at the top of the distribution, since surveys generally under-capture the incomes of the rich (Bharti, Chancel, Piketty & Somanchi, 2024, p.15).
³ Two series breaks affect the latest comparisons. The 2025 employment and earnings figures come from the revamped survey, which runs on a calendar year with a new sampling design, and the ministry cautions that they may not be strictly comparable with earlier rounds. The value-added figures move to a new national-accounts base from 2022-23. The old and new series are shown side by side and are not spliced, and the 2024-25 value-added figure is paired with 2025 earnings.